Tue, Jul 28, 2026
Volume 15, Issue 4 (Autumn 2025)
PTJ 2025, 15(4): 353-374 |
Back to browse issues page


Download citation:
BibTeX | RIS | EndNote | Medlars | ProCite | Reference Manager | RefWorks
Send citation to:


BibTeX | RIS | EndNote | Medlars | ProCite | Reference Manager | RefWorks
Send citation to:
Ziab H, Deeb H, Deeb H, Mazbouh R. Effects of a 6-week High-intensity Resistance and Stretching Program on Football Performance in Novice Players: A Randomized Controlled Trial. PTJ 2025; 15 (4) :353-374
URL: http://ptj.uswr.ac.ir/article-1-750-en.html
URL: http://ptj.uswr.ac.ir/article-1-750-en.html


1- Department of Physical Education, Faculty of Education, University of Sciences and Arts in Lebanon, Beirut, Lebanon.
2- Department of Physiotherapy, Faculty of Public Health, Lebanese University, Beirut, Lebanon.
2- Department of Physiotherapy, Faculty of Public Health, Lebanese University, Beirut, Lebanon.
Keywords: Static stretching, Resistance training, Football, Athletic performance, Athletes, Adolescent
Full-Text [PDF 2304 kb]
(2129 Downloads)
| Abstract (HTML) (2037 Views)
Full-Text: (1143 Views)
Introduction
Several studies have evaluated the impact of various training protocols on football players’ performance and injury risk. Stretching and resistance training are two vital techniques that have been widely studied and recommended as key components of a training session, either before competition or after a sports injury, due to their impact on speed and force generation, which are crucial issues in competitive sports [1, 2].
Static stretching exercises (SSE) are commonly used in many warm-up protocols [3, 4], especially in sports that require flexibility. Static stretching involves positioning the joints or limbs so that the muscles and connective tissues are stretched to their maximum length. Stretching should last 15-30 seconds [5]. However, no agreement exists in the literature on the true effect of SSE; several authors have recommended using SSE to lightly increase flexibility joints range of motion (ROM) (studies reported minimal increase in the ROM after SSE) [6, 7] and reduce the risk of injuries [8, 9], as well as influencing several performance variables, such as sprinting [10, 11], jumps [12, 13], football skills (e.g. kicking and striking) [14], balance, and reaction time [15, 16]. SSE, on the other hand, has been shown in recent studies to hurt athlete performance by reducing strength [17–19], force [17, 18, 20], and speed [21]; however, it does not reduce the risk of injury [8, 22, 23]. Therefore, it should be avoided during warm-up routines [17, 18]. Deficits in muscle force have usually been attributed to delayed onset muscle soreness and damage to contractile proteins in skeletal muscles [24].
Strength exercises, on the other hand, have been shown in several studies to improve the performance of football players [25–27]. In a highly competitive sport, the primary goal of strength training is to improve players’ specific and relevant athletic performance inherent to their sport. In this context, different variables must be considered when designing a resistance training protocol; one of the vital factors that has been extensively studied is the load. Research indicates that lower extremity strength training protocols, either low-load with high repetition and high velocity training (10-30% one-repetition maximum [1RM]) [28, 29] or maximal or supramaximal loads (120-150% 1RM) [30, 31], are effective in improving football players’ sports abilities. Accordingly, the authors of the current study used dynamic high-intensity resistance training (DHIRT), which involves applying loads between 60-80% of an individual’s 1RM, and has been linked to significant neuromuscular adaptations [32]. These include increased rate of force development, improved motor unit synchronization, and enhanced muscle fiber recruitment, particularly in type II (fast-twitch) fibers [33].
The selection of 60–80% 1RM in this study was deliberate: This range is known to be effective in enhancing both muscular strength and power without posing excessive risk to adolescent participants [32]. It also distinguishes the protocol from low-load endurance training or hypertrophy-focused programs, making it more relevant to football-specific skills, such as sprinting, jumping, and directional changes.
The authors suggest that when combined, DHIRT and SSE offer both structural and functional benefits, potentially leading to enhanced power output, endurance, and mobility in young athletes. However, to the best of our knowledge, no previous studies have addressed the combination of SSE with DHIRT in the training of novice football players.
Against this backdrop, this study aims to bridge the critical gap in the literature by investigating the combined effects of SSE and DHIRT on the performance of novice football players. In our study, novice players are defined as male adolescents aged 15-18 years who had participated in structured football training for less than three months, with no previous engagement in strength training or competitive-level football. Additionally, these participants did not exceed two football sessions per week in the six months preceding the study. This definition aligns with the criteria used in developmental training research [34].
The novelty of this study lies in its exploration of the synergistic impact of these two training modalities, shedding light on potential benefits or drawbacks that may emerge when employed concurrently. This study aims to contribute valuable insights into the field of sports science by informing training protocols tailored specifically to the unique needs of novice football players. Through an in-depth analysis over a 6-week training cycle, we aimed to elucidate the complex impact of stretching and strength exercises on key performance variables of football players.
Materials and Methods
Design
This single-blinded RCT was conducted to evaluate the effects of DHIRT, SSE, and their combination (DHIRT+SSE) on football-related performance metrics in novice male football players. The assessors were blinded to group allocation to reduce bias. This study adhered to the CONSORT guidelines for reporting clinical trials and was conducted between November and December 2023.
Participants
A Google Form, in which the aims and methods of this study were described, was sent via WhatsApp and email to young male teenagers between the ages of 15-18 years in different football academies across Beirut [35]. To determine whether the applicant was qualified to participate, demographic characteristics (age, weight, height) and specific information about their sports performance (i.e. duration of football practice and strength training bodybuilding) were collected.
Participants were selected according to the following criteria:
1) Novice male football players who had been training for less than 3 months [34]. 2) No history of musculoskeletal injury in the last 6 months. 3) No other health-related problems (i.e. cardiorespiratory or systemic problems) that might affect their sports performance.
Participants who were unable to attend the whole protocol, missed more than two consecutive sessions, or refused to sign the informed consent form were excluded.
To ensure baseline equivalence across groups, independent sample t-tests were conducted for all performance variables before the intervention, confirming no statistically significant differences (P>0.05) between groups at baseline.
Sampling and allocation concealment strategies
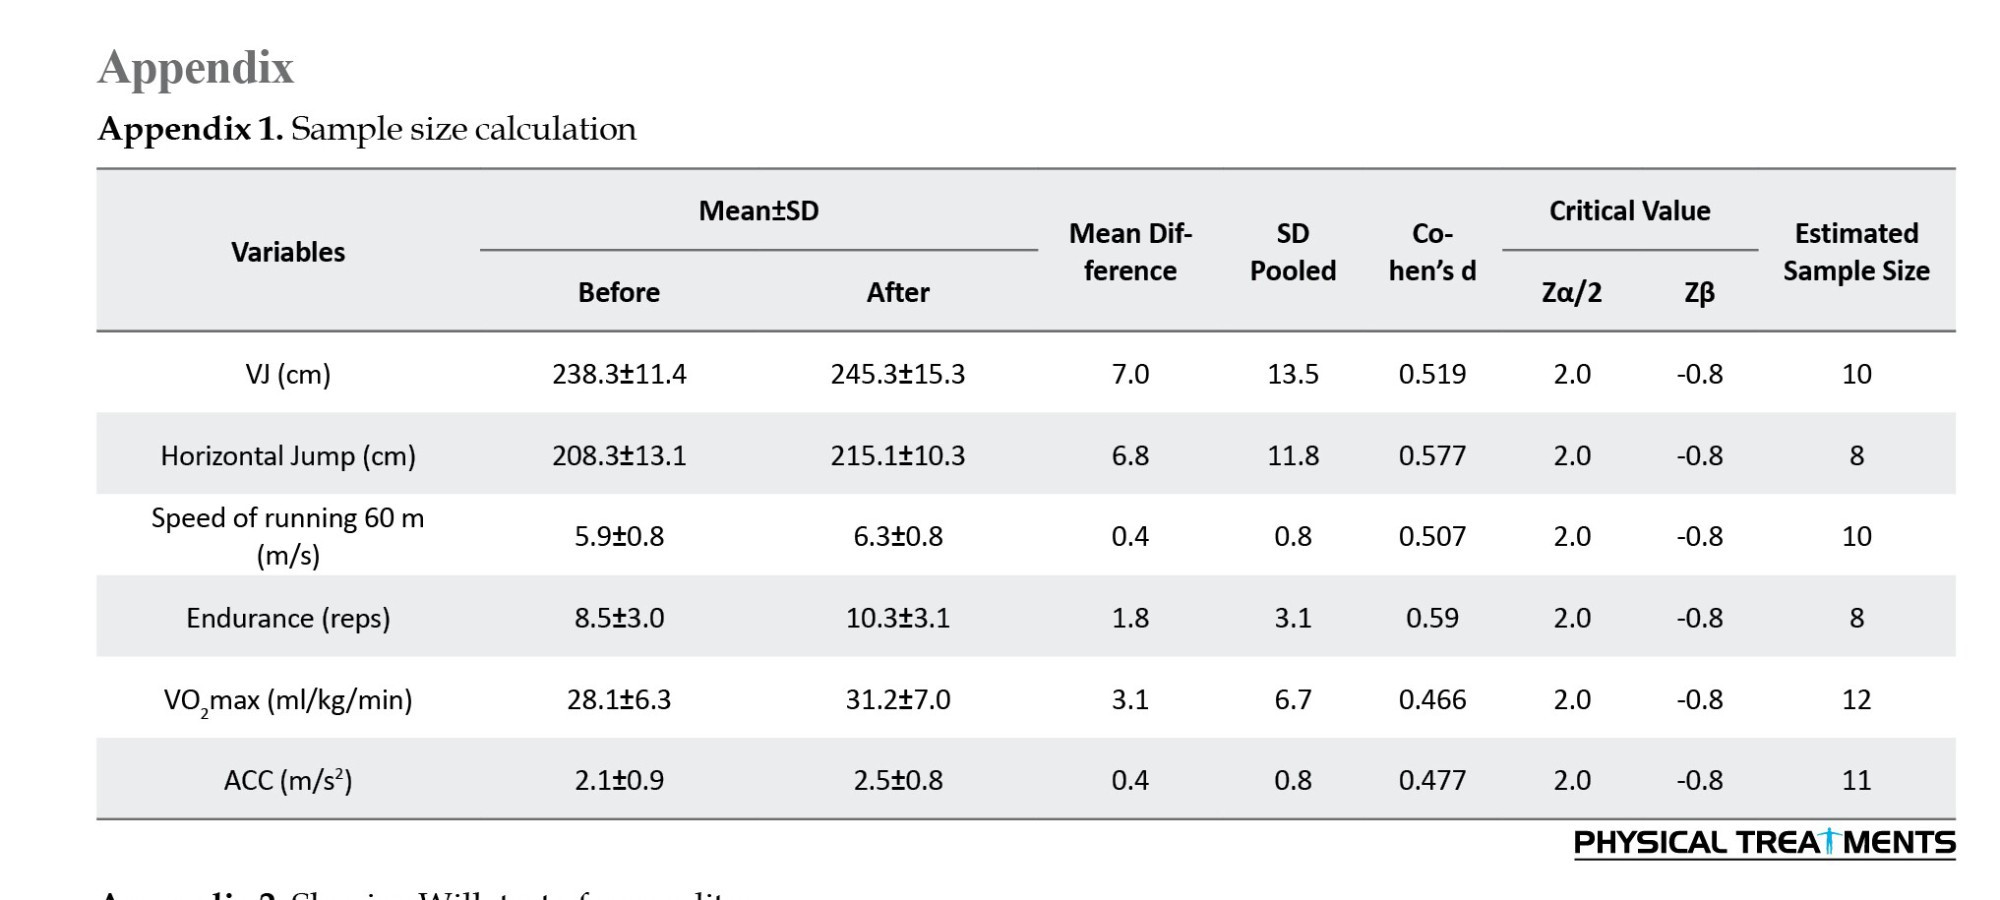
A priori power analysis was conducted using G*Power software, version 3.1.9.7 to determine the required sample size for this RCT. A pilot study involving five novice football players in each Group (SSE and DHIRT) provided initial data on multiple performance metrics. For each variable, we calculated the mean difference, pooled standard deviation, and Cohen’s d to estimate effect sizes (ES). Using a significance level of α=0.05 and power of 0.80, the required sample size for each outcome was determined.
To ensure adequate statistical power across all outcomes, we adopted a conservative approach using the largest sample size estimate among all calculated metrics (12 participants per group) as the basis for recruitment. This decision was made to ensure that the study was sufficiently powered to detect meaningful differences, particularly for variables with small ESs. For full details of the power analysis and calculations, please refer to Appendix 1.
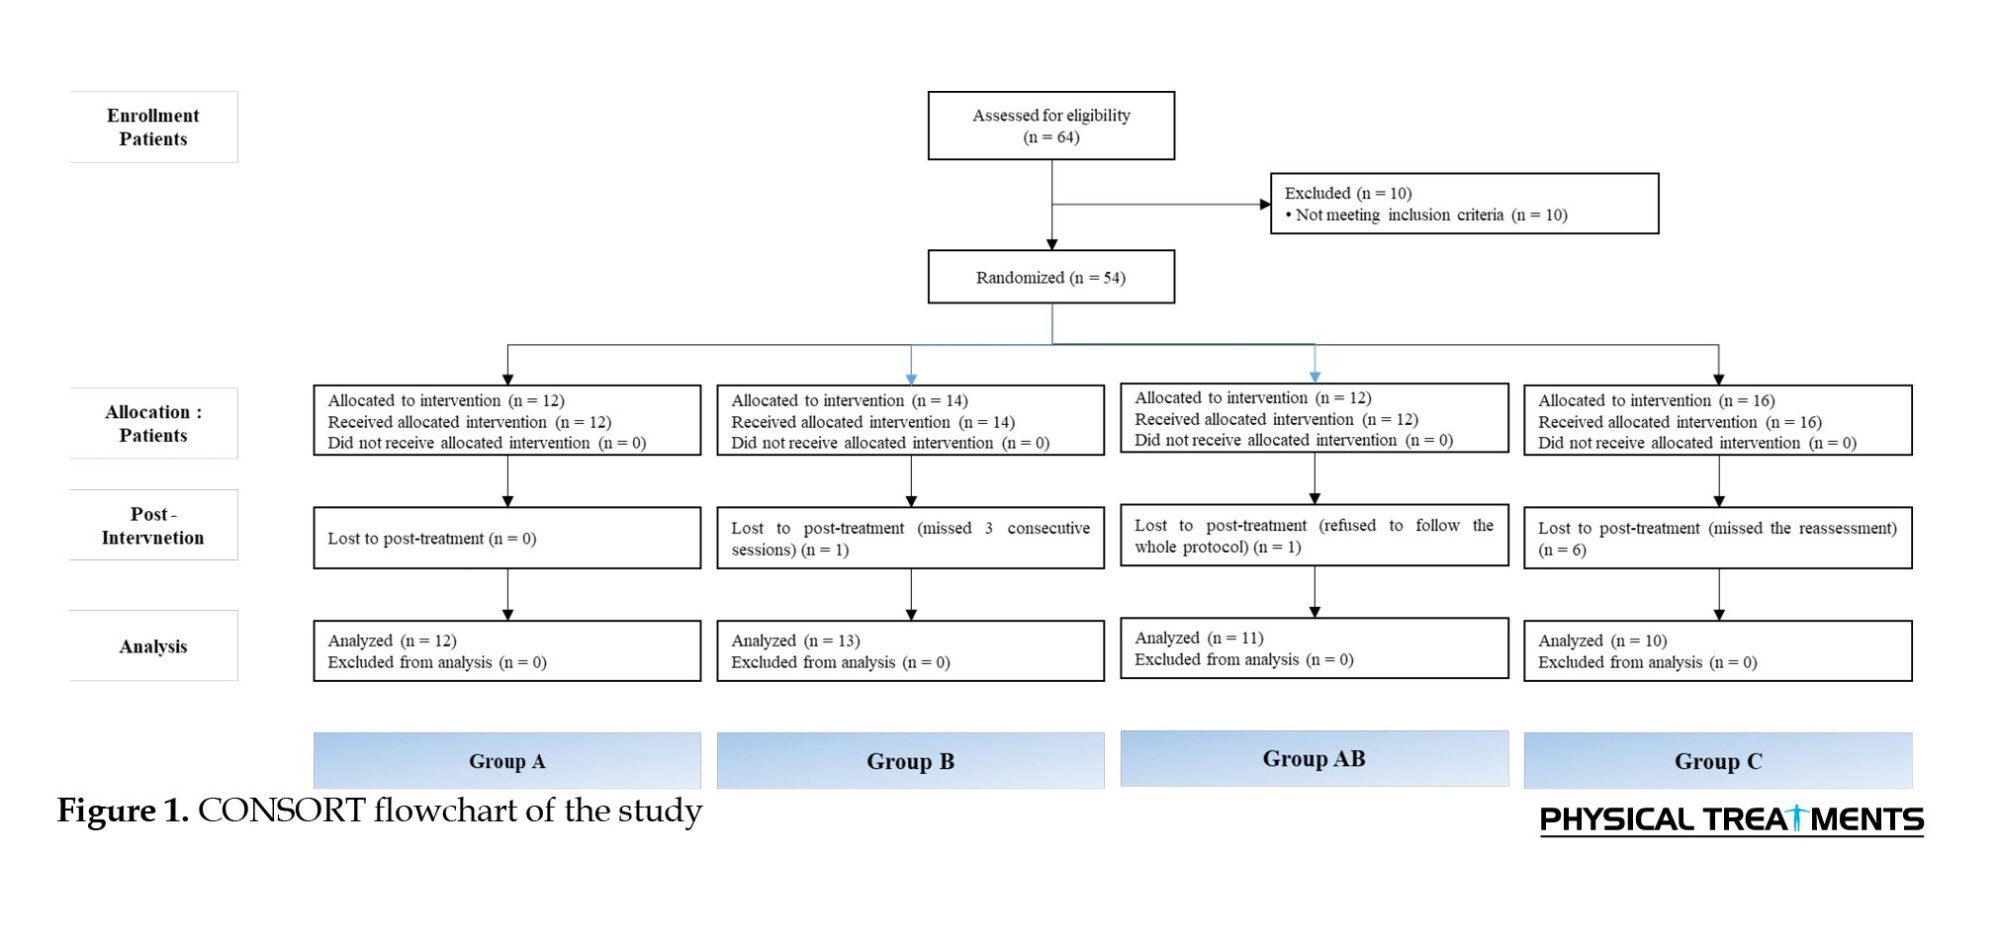
Subsequently, all eligible participants were randomly assigned to groups using a concealed allocation process. Group assignments were determined using a computer-generated randomization list and concealed in sealed, opaque, sequentially numbered envelopes prepared by an independent researcher who was not involved in recruitment or assessment. Envelopes were opened only after participants were confirmed eligible, ensuring unbiased group allocation. The groups were as follows: A (DHIRT), B (SSE), AB (combined DHIRT and SSE), and C (control) (Figure 1).
Outcome measures
The football-related skills refer to the ability to perform a motor task with maximum accuracy and minimum energy or time [36]. Accordingly, different variables were assessed in this study, including jump abilities (vertical and horizontal), running abilities (speed, endurance, and acceleration [ACC]), shooting speed (SS), joint mobility, and physiological parameters after effort (maximum oxygen volume [VO2max] and heart rate [HR]).
To reduce the risk of injury, each participant received a 10 to 15-minute warm-up session before the evaluation. The training included jogging, running with and without the ball, as well as stretching exercises for the hamstrings, quadriceps, and triceps muscles. It is worth noting that the tests were conducted outdoors on artificial grass under dry and warm conditions.
Shoot speed test
Shooting refers to the attempt to score a goal by striking the ball with speed, strength, or accuracy. With sneakers suitable for soccer and using Gabonese football (Conti, circumference of 69.0 cm and mass of 440 g), the assessors asked the participants to shoot the ball at the center of the goal, which was 11 m away, using the foot that they felt was most suitable to successfully complete the task. The test was repeated thrice, and the time of the fastest kick was recorded. Each player was given a minute break between the kicks (Figure 2).
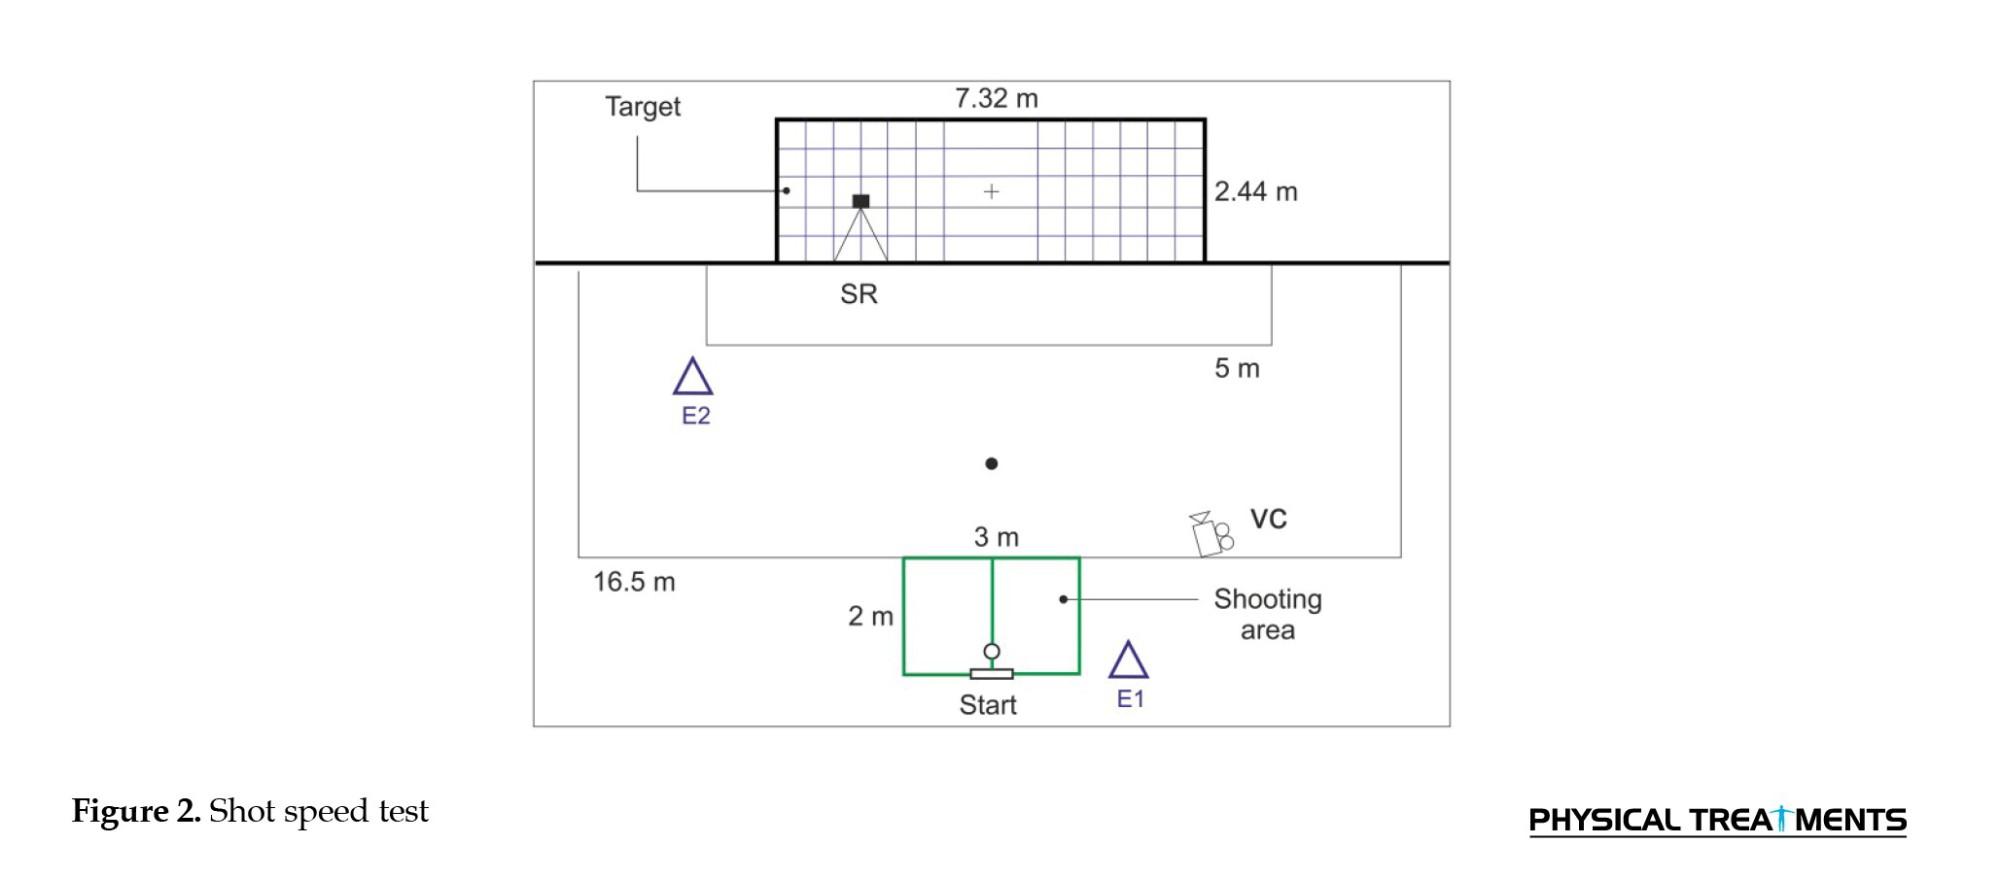
A video camera (SonyTM, HDR-PJ20, Japan) with a maximum resolution of 1920 x 1080 px was placed near the imaging area (VC, Figure 2), and time was counted from the moment the participant’s foot touched the ball until it reached the goal line [37]. Using the free online “Kapwing” program, the video of each shoot was slowed to a minimum speed, and the first time the player’s foot reached the ball was logged, as well as the time the ball crossed the goal line. The total time spent between the two times was then computed. The time displayed on the screen was used as a guide for the measurements. The speed was then measured using the Equation 1:
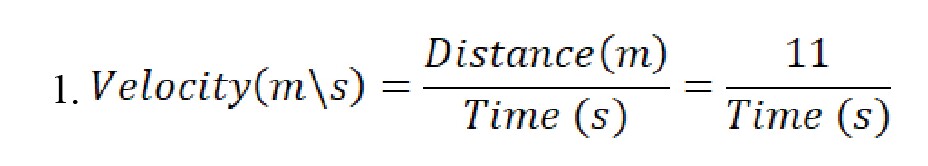
where velocity is measured in m/s, and time is extracted from videos in seconds, and the distance is constant for all trials (11 m) [38].
It is worth noting that, according to Murray et al. this method of evaluating RS using 2D video-camera analysis is a reliable technique for measuring speed, with an intraclass correlation coefficient (ICC) of 0.98 [39].
Endurance
Athlete endurance refers to the ability of an athlete to perform work over an extended period. The “multistage fitness beep test” is a reliable measure of endurance in sports activities; it is a multistage fitness test (MSFT) commonly used as a maximum aerobic fitness test [40] (Figure 3).
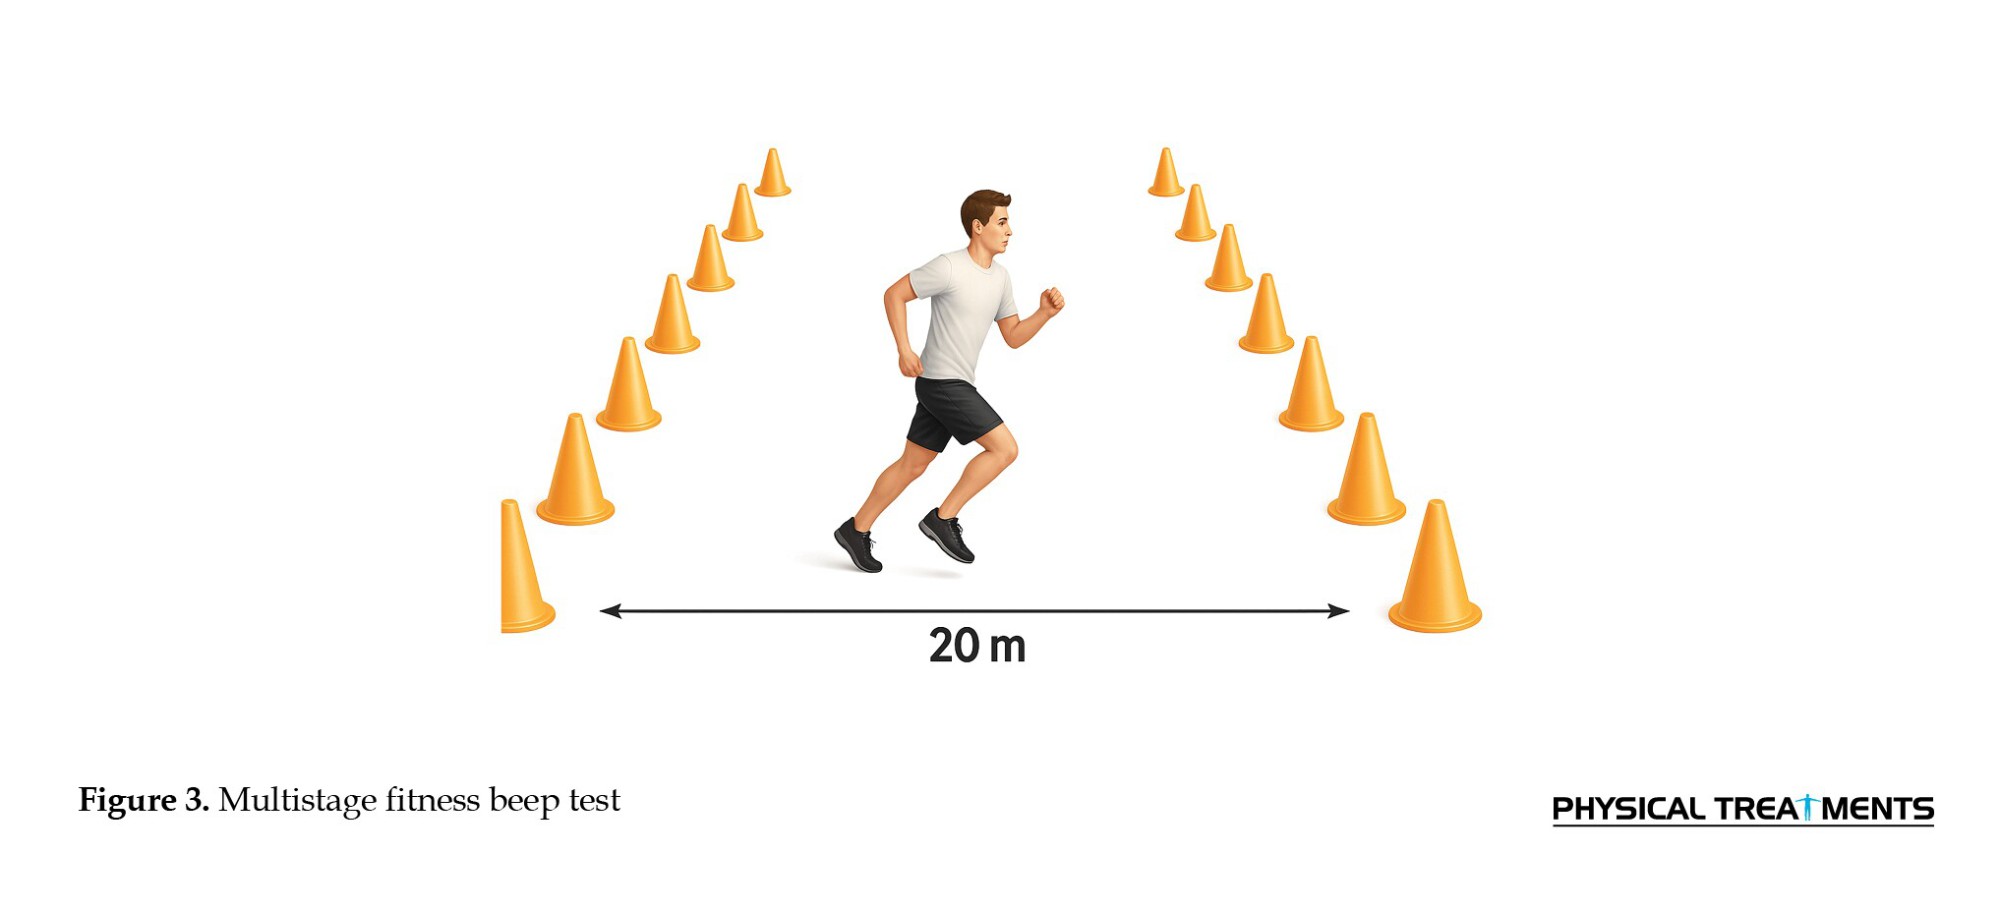
This test entails running continuously between two cones 20 m apart at an appropriate time. Participants began by running at a pace that allowed them to cross 20 meters in five seconds, and then they switched directions when instructed by the assessor. If a participant did not reach the line within 5 s, they received a warning and were required to continue running to the line. Following the second warning, the data were recorded by the number of times the participants successfully crossed the line [41].
The RSs
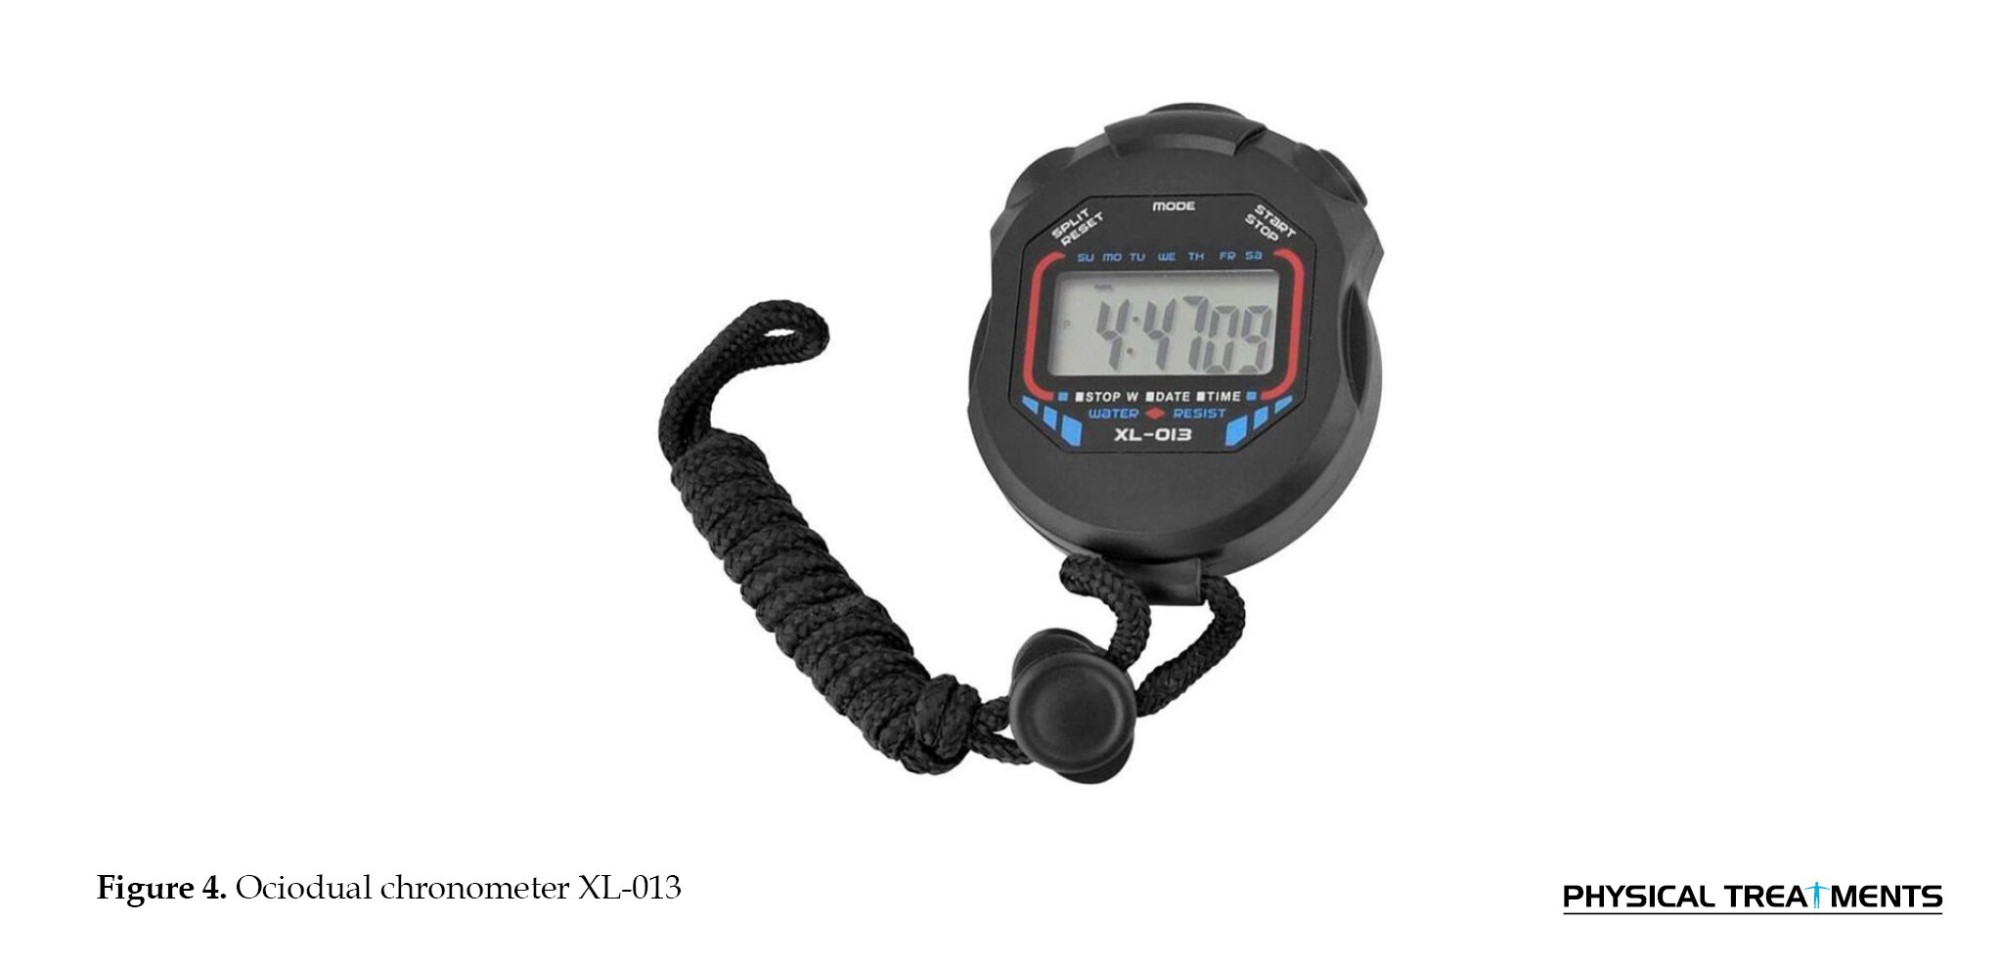
The time taken to run 60 m was computed using an adequate chronometer (Ociodual Chronomètre XL-013) (Figure 4).
The RS was then determined using the Equation 2 [38, 42]:
ACC
ACC performance is critical for athletes in sports that require a high level of repeat sprint ability [43], such as football. The rate of change in velocity is defined as ACC. In practice, however, ACC ability is often referred to as sprint performance over shorter distances, such as 5 m or 10 m. It is measured using sprint time or velocity, particularly among applied sports scientists and coaches.
In the current study, the time spent running 5 m was measured using a digital camera (Sony, HDR. -PJ260, Japan) positioned in the middle of two cones; the first cone was placed at the starting point, and the second cone was placed 5 m away on a 60-m running track. The time was extracted from the video recording using “Kapwing” software. Due to the stability before starting the run, the initial time and speed were considered zero [34]. The ACC was then calculated using the Equations 3, 4 and 5:
With t1=0, v1=0.34
Then,
ACC was measured using video-based timing, which has been validated in previous studies with ICCs exceeding 0.90 when the camera position and frame analysis were standardized [44] (Figure 5).
Vertical and horizontal jumps (HJ)
The vertical jump (VJ) is a test of lower-body strength. Sargent’s jump test was performed using a measuring tape attached to the wall. The participant stood close to the wall, with the shoulder fixed at 180° and the elbow fully extended. The athlete jumps vertically at the highest possible level and marks the tape. The distance between the athlete’s standing reach height and jumping reach height was recorded. The test was repeated three times and the highest jump was considered [45, 46].
The HJ or long jump is a common and easily managed test used to assess explosive leg strength. A measuring tape was used to measure the distance travelled, and a two-foot take-off and landing was used, with arms swinging and knees folding to provide forward oscillation. The participants were instructed to jump as far as possible and land on both feet together. They were asked to make three attempts to choose the most far-reaching distance [46].
These methods have shown high reliability in adolescent populations, with reported ICC of 0.91–0.97 [47].
Maximum oxygen rate
Maximal oxygen uptake is considered the best indicator of aerobic capacity and maximal cardiorespiratory function [48]. It refers to oxygen consumption during stress tests or when exercising hard [42].
It is a measure of fitness in terms of an individual’s ability to tolerate long periods of moderate-to-vigorous physical activity. As a result, a 12-minute Cooper race test was used as a valid and reliable measure of maximum aerobic fitness, with a minimal standard error of estimate (SEE=0.193 mL/kg/min) [49]. It entails asking participants to move as far as they can in 12 minutes and then to record the total distance traveled [50, 51]. Consequently, VO2max is measured using the Equation 6:
6.
Procedures
Following randomization, participants completed 24 supervised training sessions between November 8 and December 15, 2021. Certified strength and conditioning specialists conducted all sessions, each holding at least a bachelor’s degree in physical education and prior experience working with adolescent athletes. To ensure methodological consistency, all trainers were thoroughly briefed and adhered to a standardized intervention protocol, covering exercise technique, load progression, session timing, and instructional delivery. To minimize variability, each trainer was assigned to the same Group throughout the intervention. The final group allocation was as follows:
Group A
The term “high intensity” in this study refers to resistance loads prescribed at 60–80% of the estimated one-repetition maximum. 1RM was estimated using the Brzycki formula [52], a submaximal prediction method validated for use in adolescent populations. This intensity range is consistent with the recommendations of the National Strength and Conditioning Association and the American College of Sports Medicine for high-intensity resistance training in youth [34, 53].
Participants in the DHIRT group followed a push–pull–legs split program, performed four times per week for six weeks. A progressive linear loading model was used, beginning at 60% of estimated 1RM in the first week and increasing gradually by approximately 5% each week, reaching 80% of the 1RM by the final training phase. Load adjustments were made based on weekly performance reassessments and participant feedback, ensuring both progressive overload and safety. The 1RM estimates were updated mid-protocol to accommodate strength gains. All training loads were individualized by muscle group based on the initial strength assessment [33] (Table 1).
Each session began with a 5-minute general warm-up, consisting of running on a treadmill, followed by a very light free-weight warm-up (<20% of RM). Subsequently, one hour of DHIRT was applied.
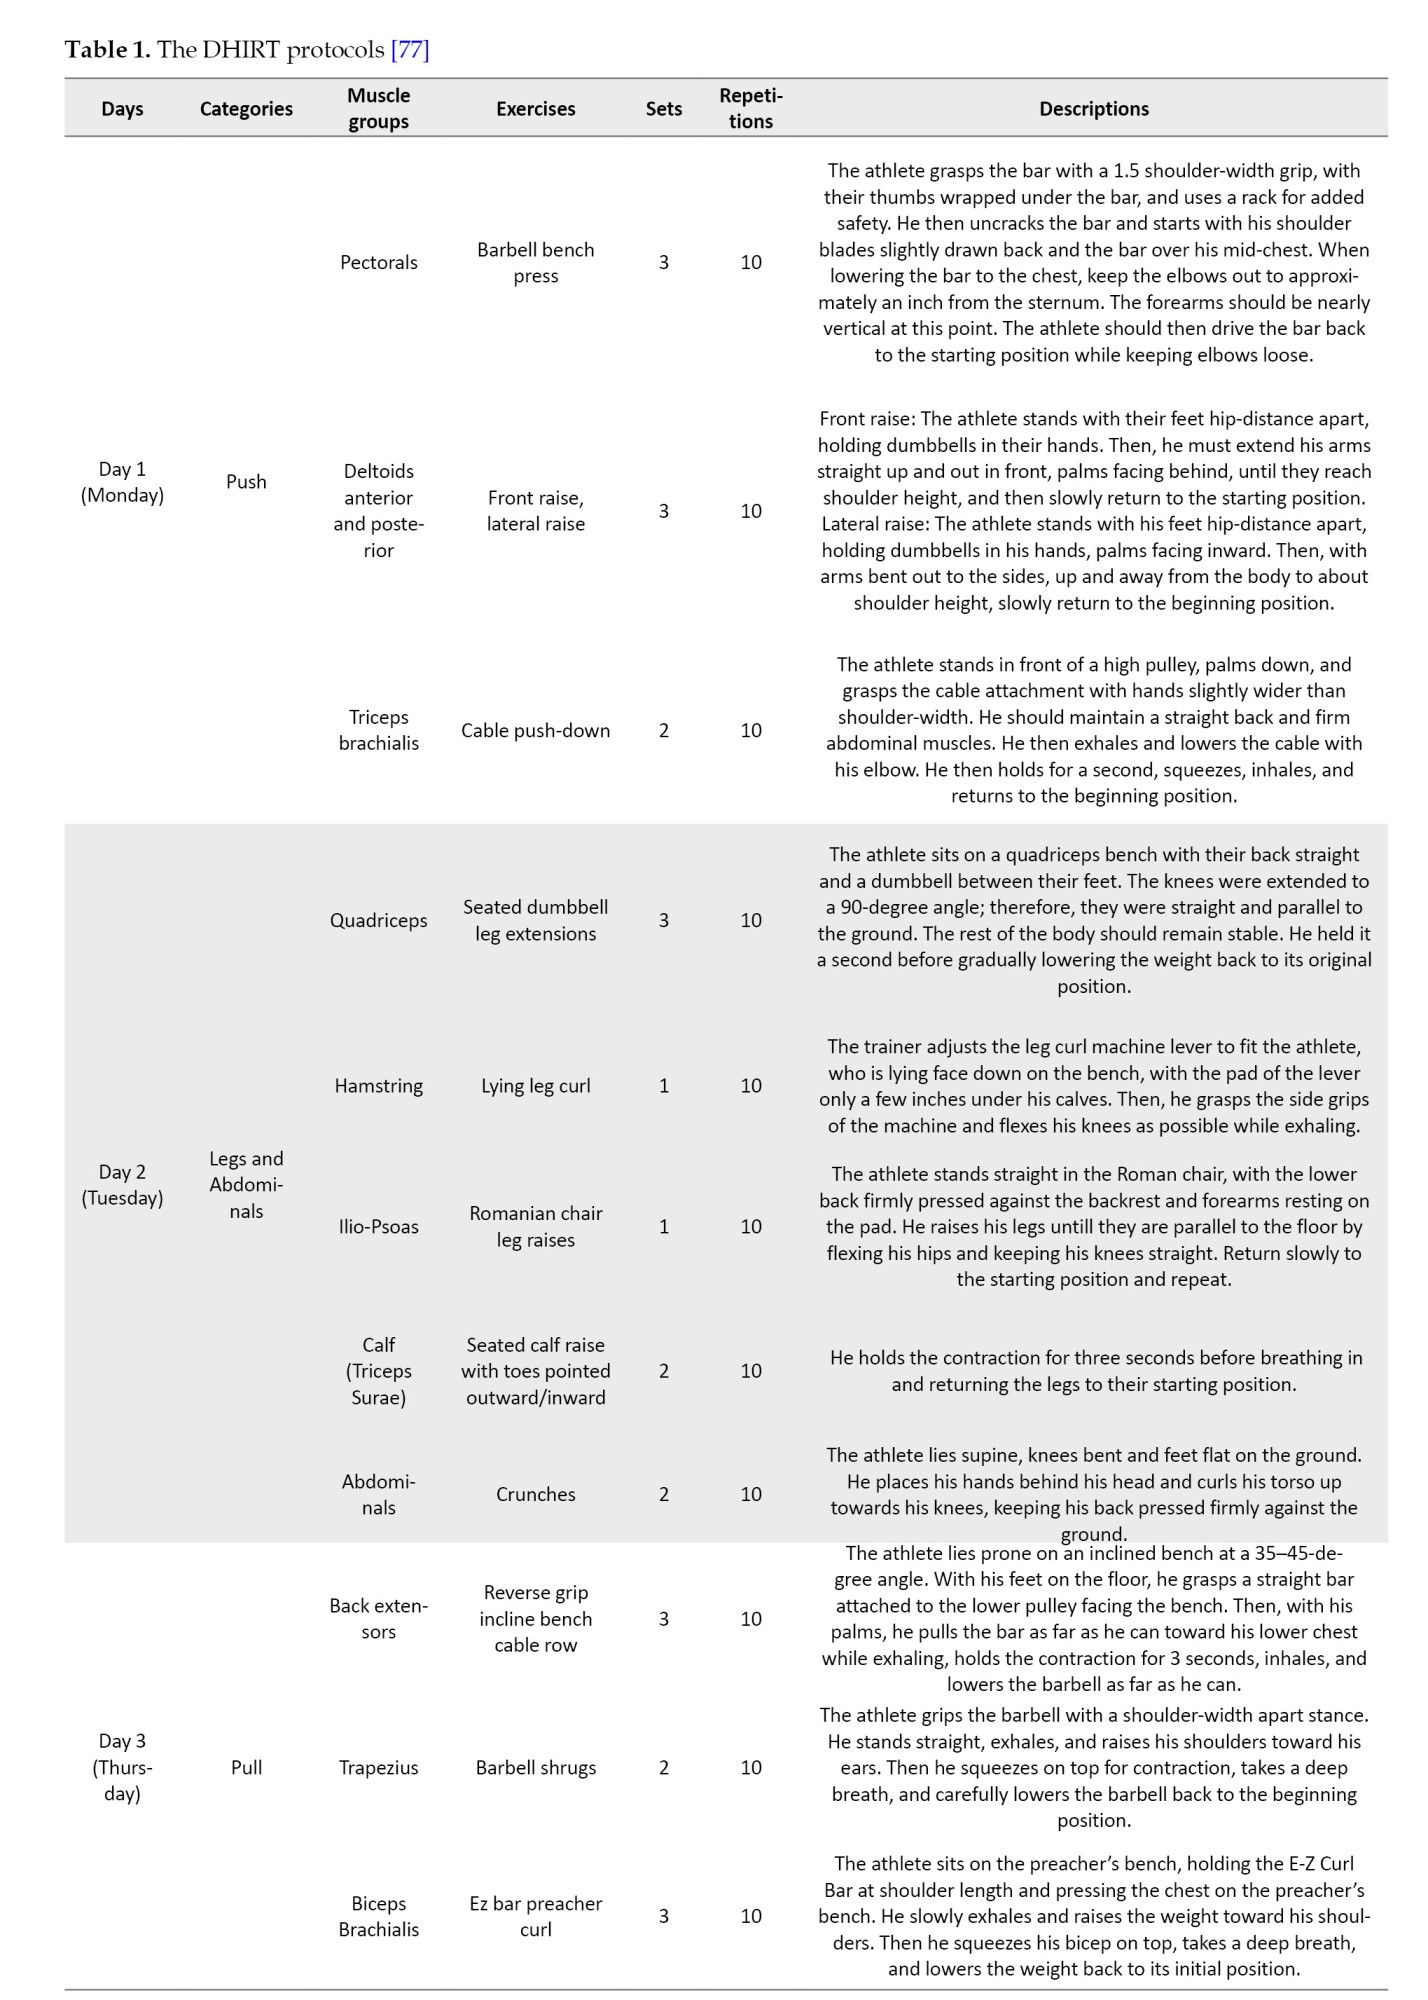
Group B
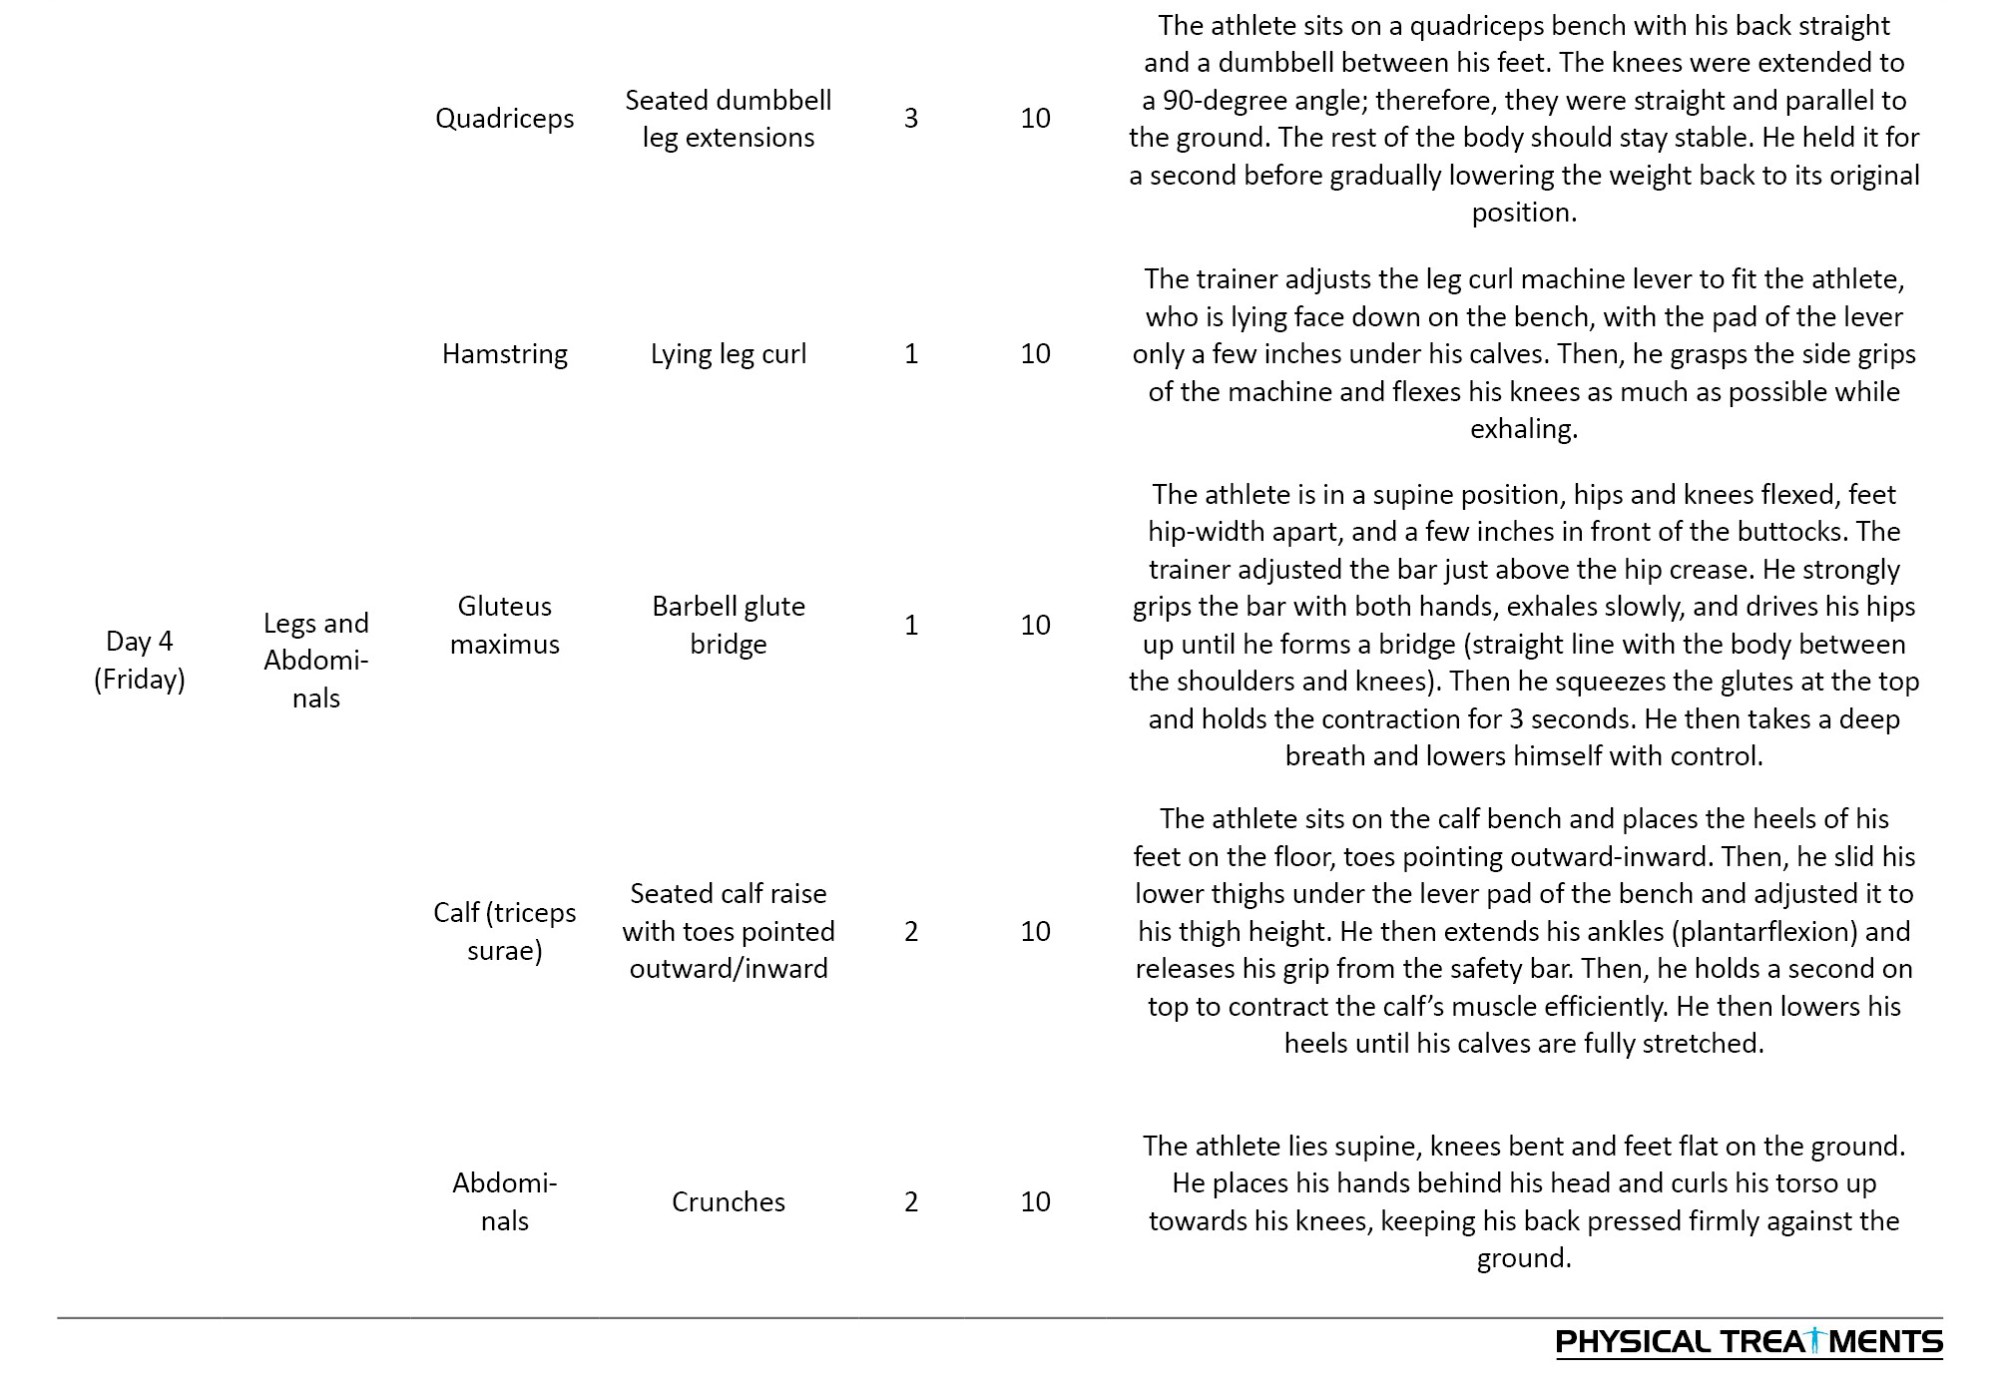
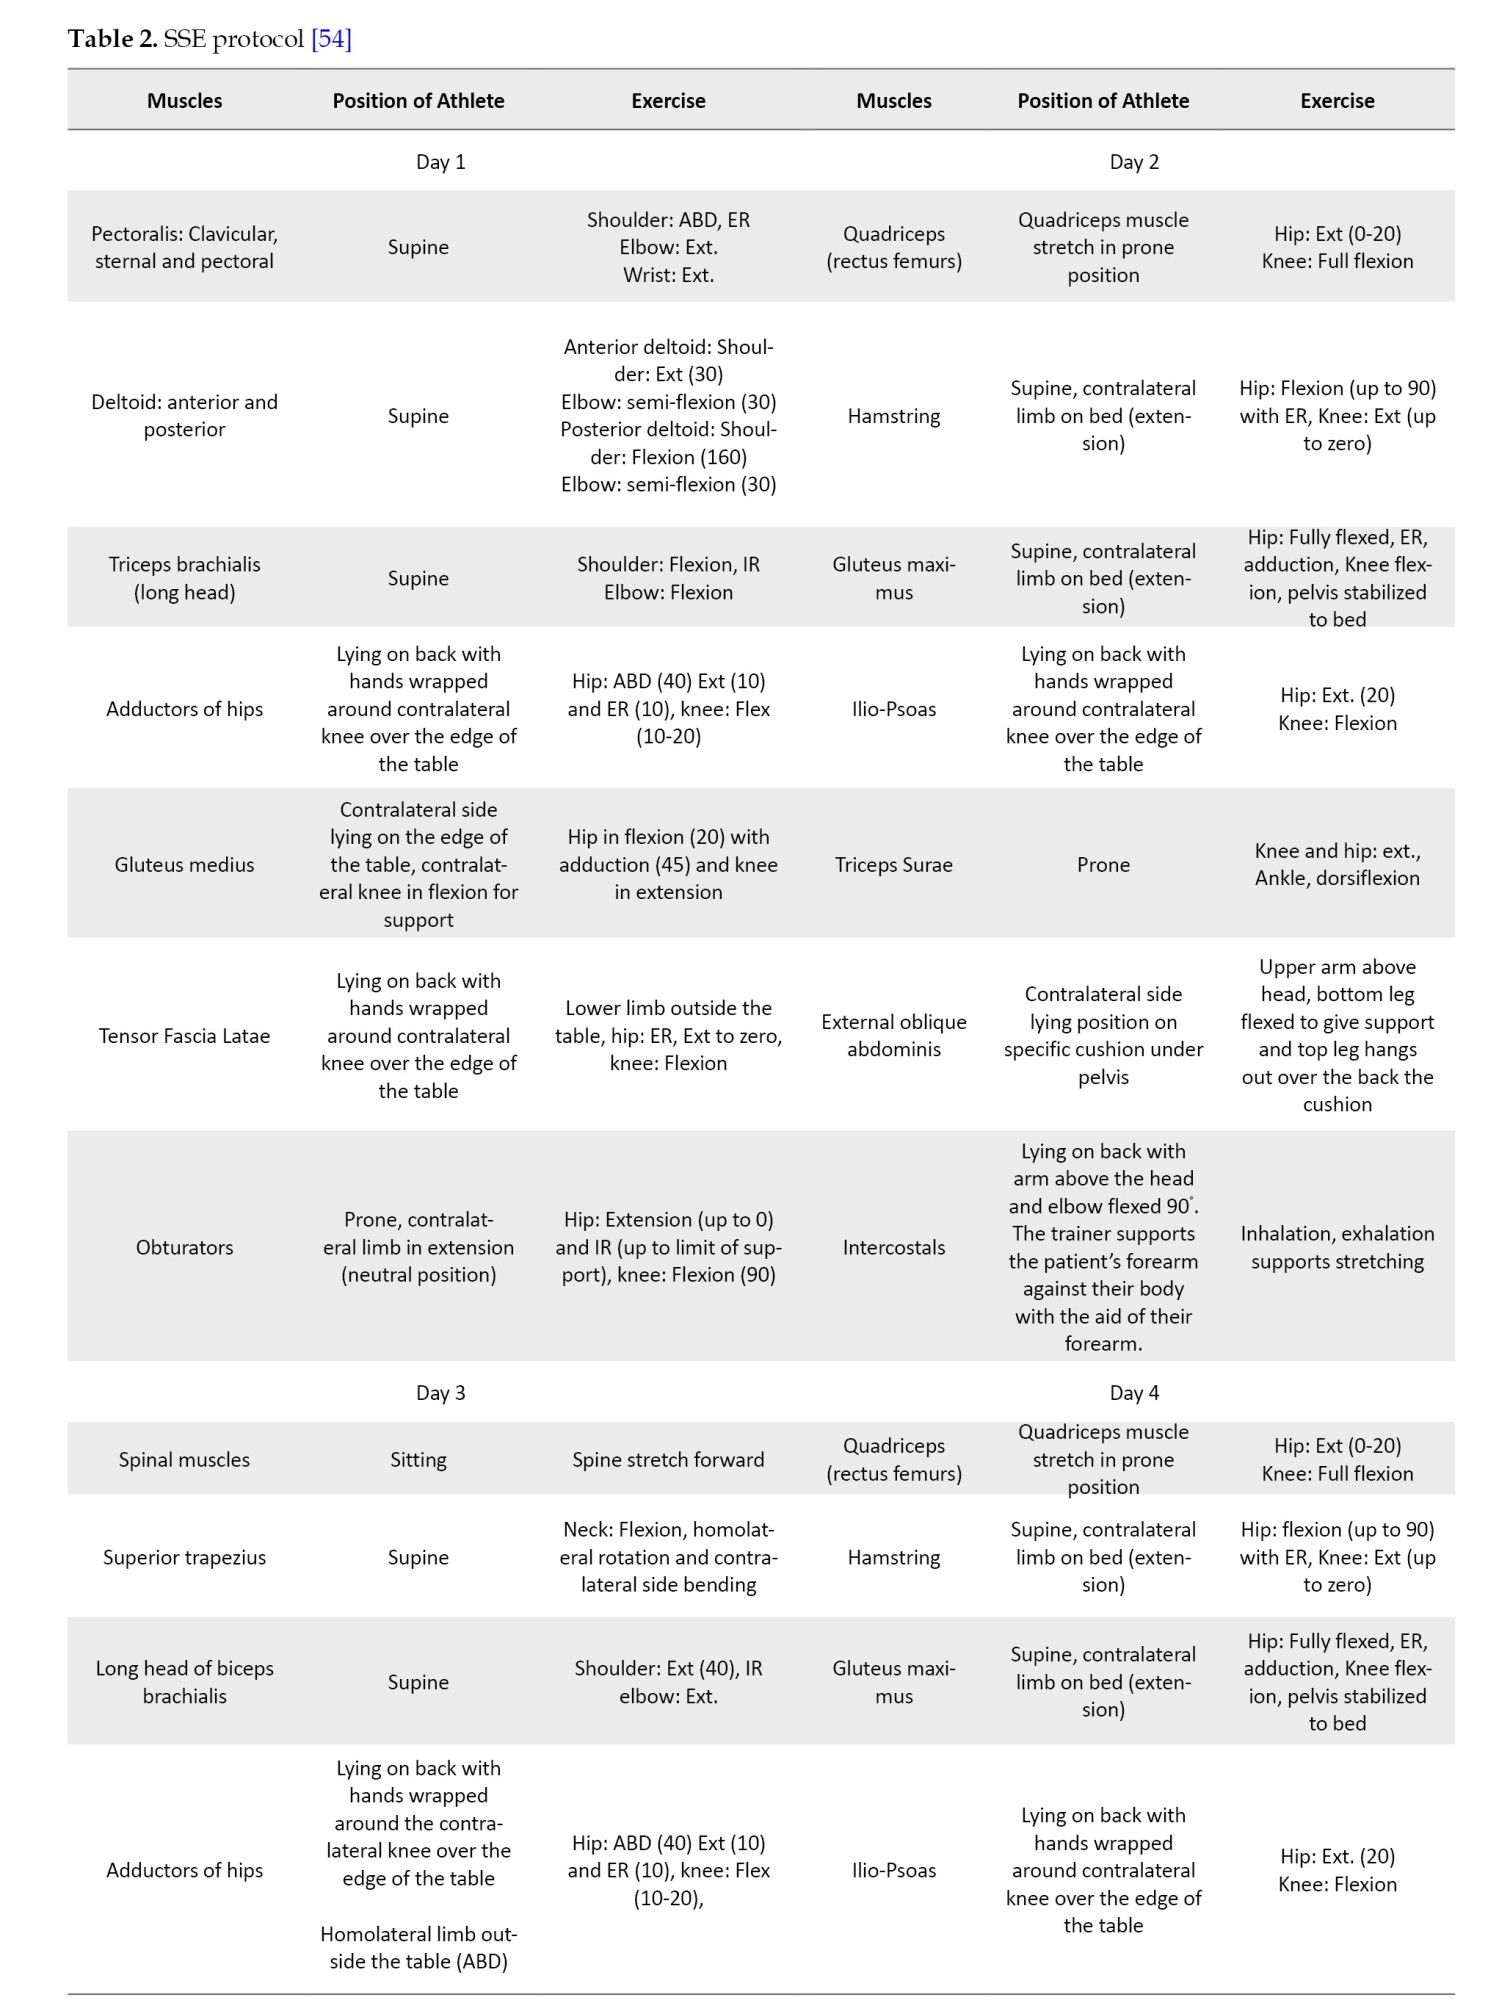
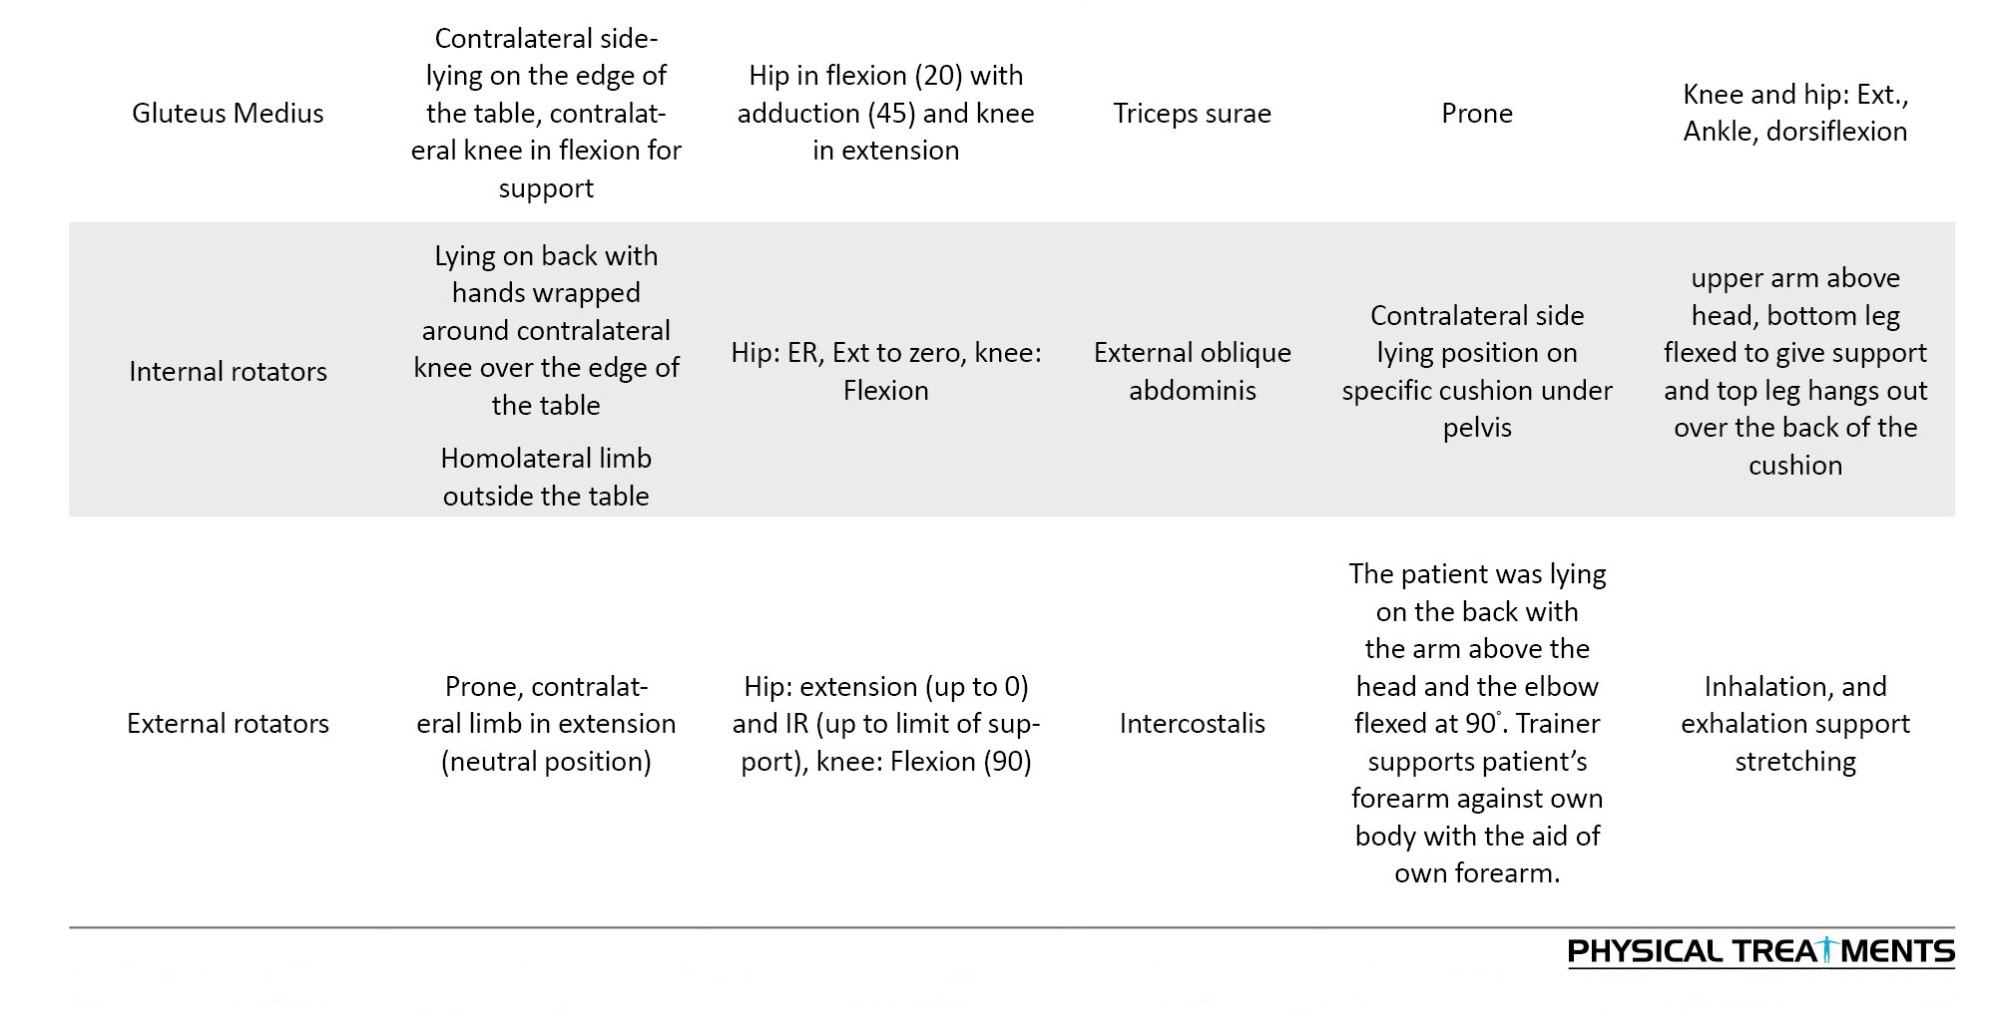
Group B consisted of a protocol of SSE of the gross muscles of the whole body with a higher focus on the muscles of the lower extremities (Table 2).
It is worth noting that each exercise was applied for 15 to 30 s, with three repetitions per session. The athlete was instructed to lean on his back in a relaxed position and avoid unnecessary contraction or any risk of injury. In case the athlete felt any pain or unsupported tension, he was instructed to raise his hand, and the trainer immediately stopped the exercise [54].
Group AB
Given that multiple studies have demonstrated the need to design a holistic protocol that improves all aspects of training for athletes to enhance their performance, rather than focusing solely on specific approaches, such as stretching or strength training, the authors combined both protocols in group AB to examine their effect on participants, with the hypothesis that better improvement in fitness-related outcome measures will be recorded when compared to other groups.
Accordingly, the same DHIRT program used in group A was used in this group, with the same intensity and frequency for each exercise. In addition, a global muscle SSE program with a greater focus on muscle strengthening was introduced. Stretching exercises were applied immediately after the strengthening exercises in each session. Each exercise was performed twice.
It is worth noting that if any participants in groups A, B or AB missed a training session, a makeup session was held on Saturdays.
Group C
The control group was included to isolate the effects of the training interventions by providing a reference with no structured physical conditioning. The participants in this Group did not participate in any supervised training or structured exercise sessions during the study. However, they were permitted to continue their usual informal football and physical activity routines, which they had been practicing regularly before the study. This ensured that their activity levels reflected their natural baseline behavior, without introducing new training effects that could influence the outcome measures.
Statistical analysis
Statistical analyses were conducted using SPSS software, version 26 (SPSS Inc., Chicago, Illinois, USA). The normal distribution of data was examined using the Shapiro-Wilk test and Q-Q plot. In addition, an analysis of variance (ANOVA) test was used to compare participants and detect any significant differences at baseline. Moreover, descriptive statistics were calculated for the demographic data using Means±SD.
An independent t-test was used to compare pre and post-tests concerning group allocation. Moreover, comparisons between groups were performed using repeated-measures ANOVA. The level of significance was set at P<0.05. Moreover, post-hoc pairwise comparisons were conducted using the Bonferroni correction to adjust for multiple testing and reduce the risk of Type I error
ES was calculated using Partial Eta Squared (η2). The magnitude of the ESs was classified as small (0.01), medium (0.06), or large (>0.14). A P<0.05 was used to detect significance [55, 56].
Results
Descriptive analysis
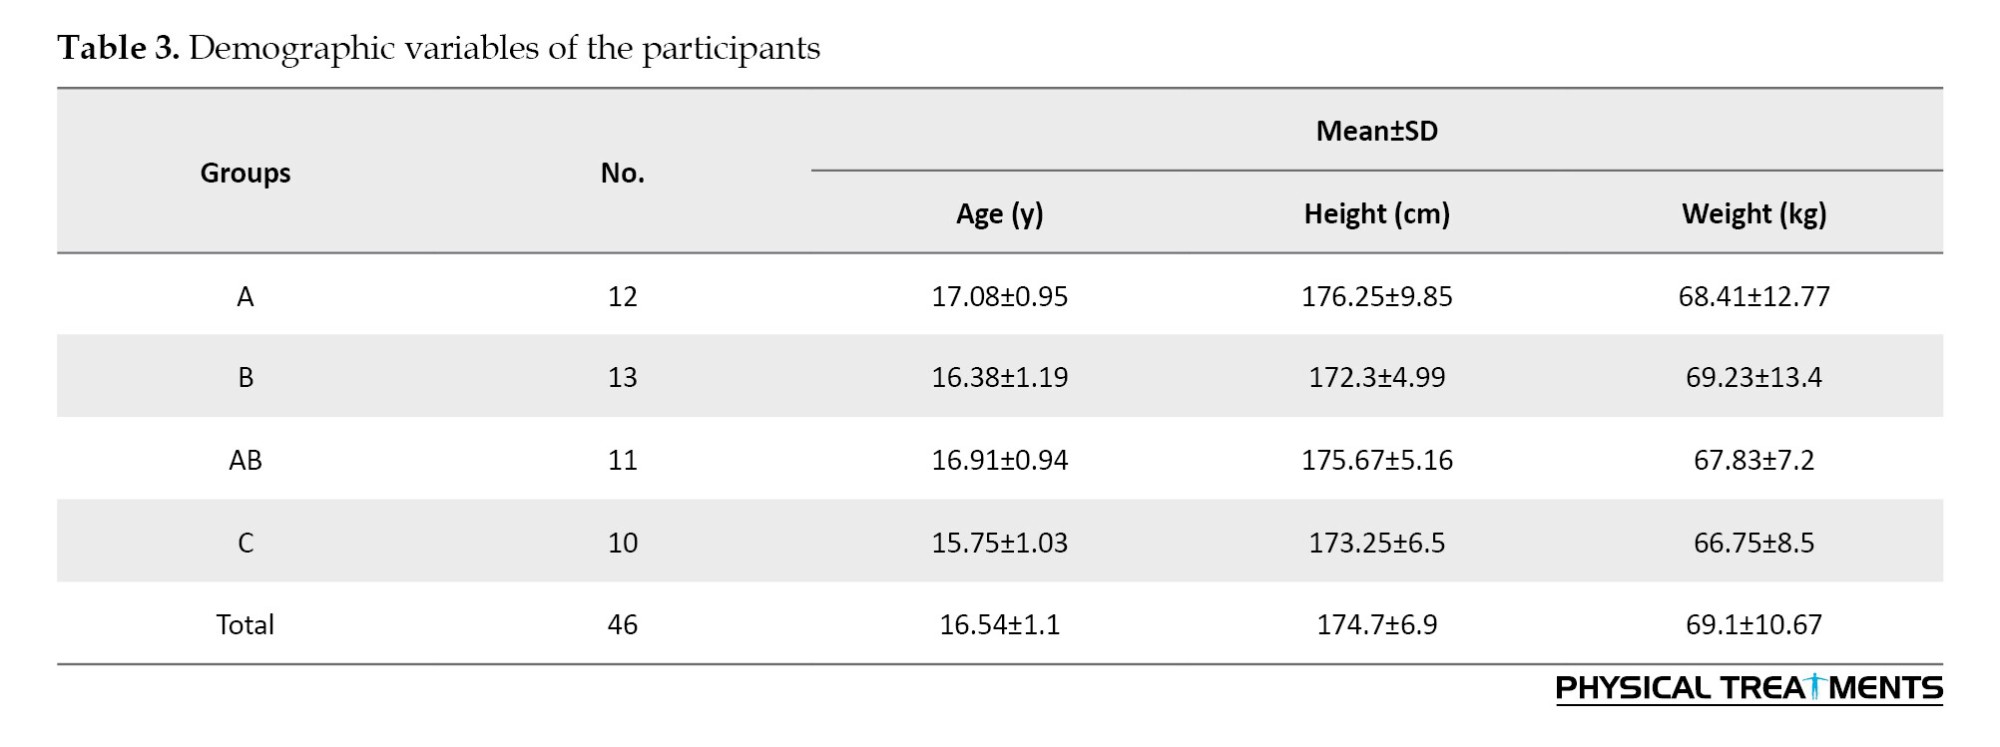
Initially, 64 participants were enrolled in the study. Ten were excluded because they did not meet the inclusion criteria. Eight participants dropped out during the intervention. The analysis followed a per-protocol design, including only participants who completed the full intervention protocol and attended at least 90% of the training sessions. Dropouts were excluded from the final analysis to preserve the integrity of intervention effect estimates Finally, the outcomes of 46 participants were analyzed. The mean age, weight, and height of the participants were 16.54 years, 69.1 kg, and 174.7 cm, respectively (Table 3). Figure 1 shows the CONSORT flowchart of this study.
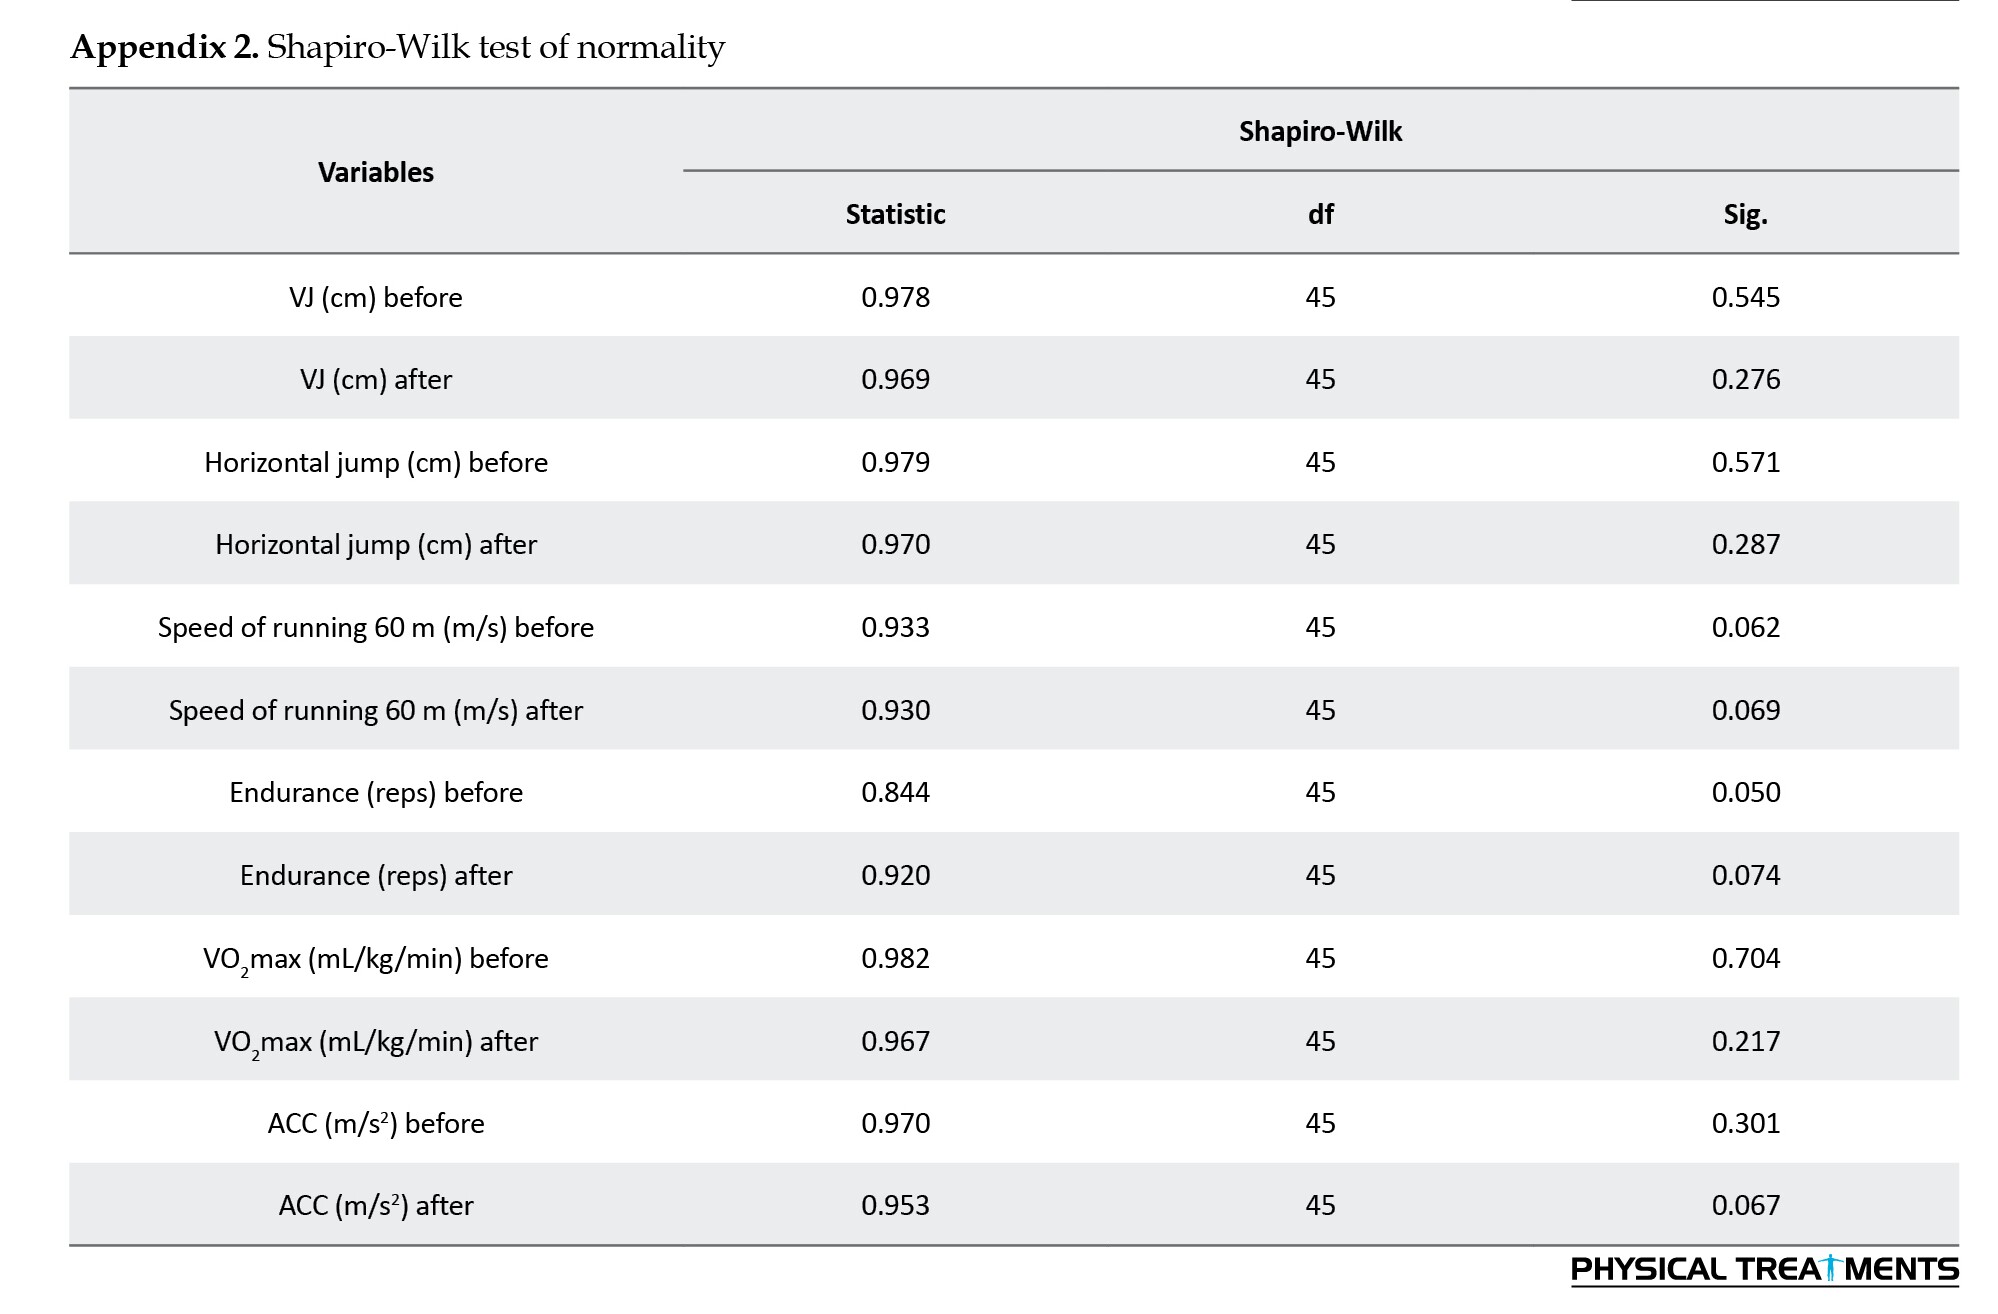
To validate statistical assumptions, the Shapiro–Wilk test showed that all performance variables at baseline were normally distributed (P>0.05) (Appendix 2). This was further supported by visual inspection of histograms and Q–Q plots, which indicated approximate normality across variables. Although the P for endurance at baseline was at the threshold (P=0.050), the sample size (n=46) provided sufficient robustness through the Central Limit Theorem, supporting the use of parametric tests.
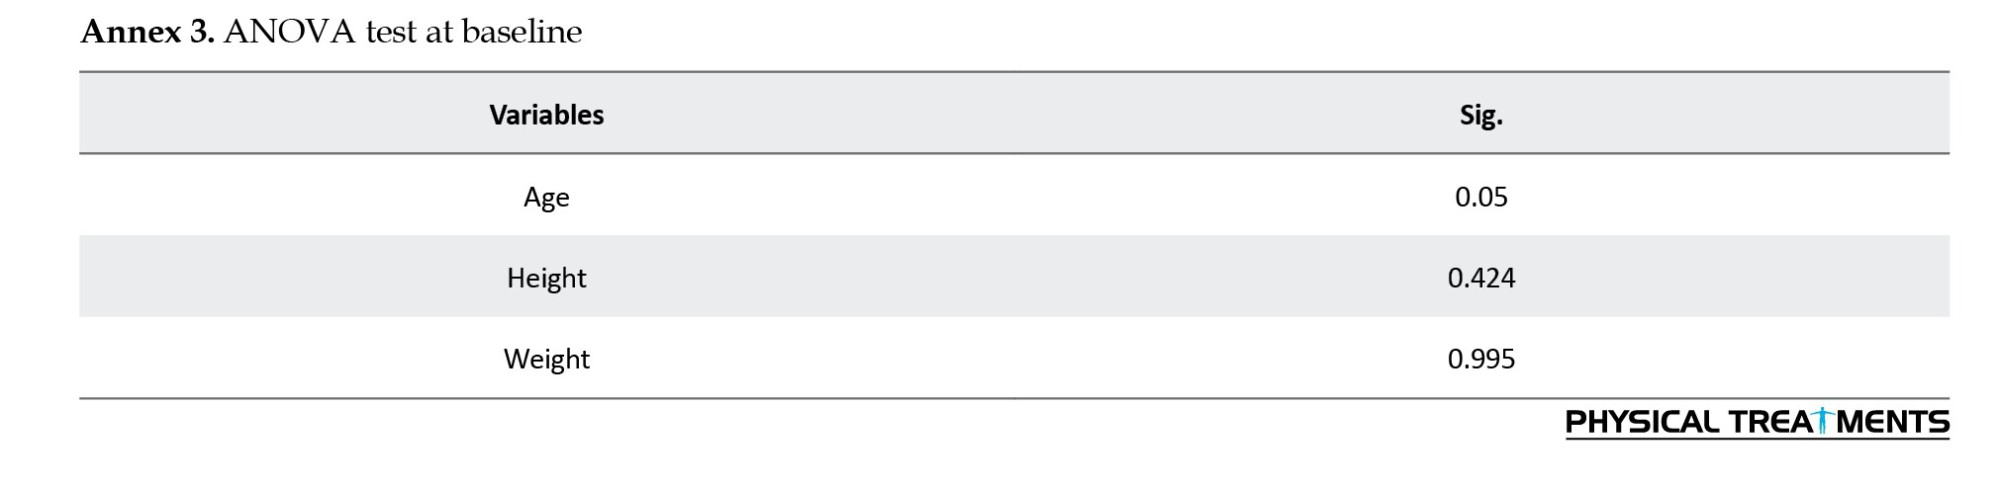
Baseline comparability among groups was also confirmed: No significant differences were found in demographic variables (age, height, and weight) across the four groups (P>0.05) as assessed by one-way ANOVA (Tables 4 and 5, Appendix 3).
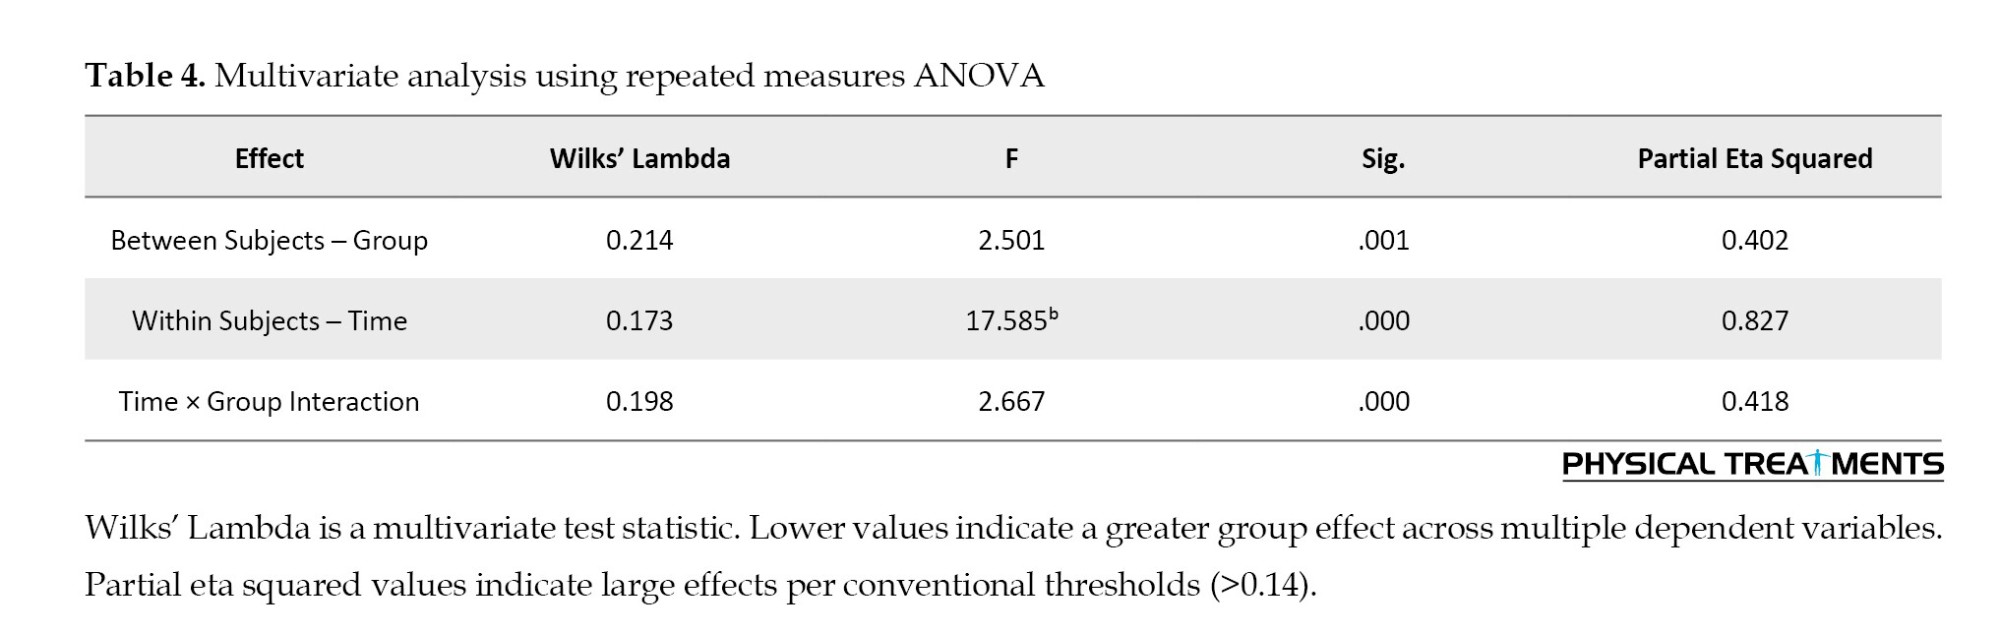
The repeated measures ANOVA multivariate analysis revealed significant differences between and within groups (P<0.05). Accordingly, the univariate tests revealed significant changes in all variables except SS in the within-group analysis (time comparison) and HR in the between-group analysis.
Additionally, a significant time * group interaction was observed in the within-group analysis of different variables (i.e. HJ, VJ, RS, and hip ROM), indicating the superiority of one Group over the others across time (Table 6).
Furthermore, as shown in Table 6, large ESs were reported, revealing the great impact of the three interventions on all participants in all groups (0.402 ≤η2≤ 0.827).
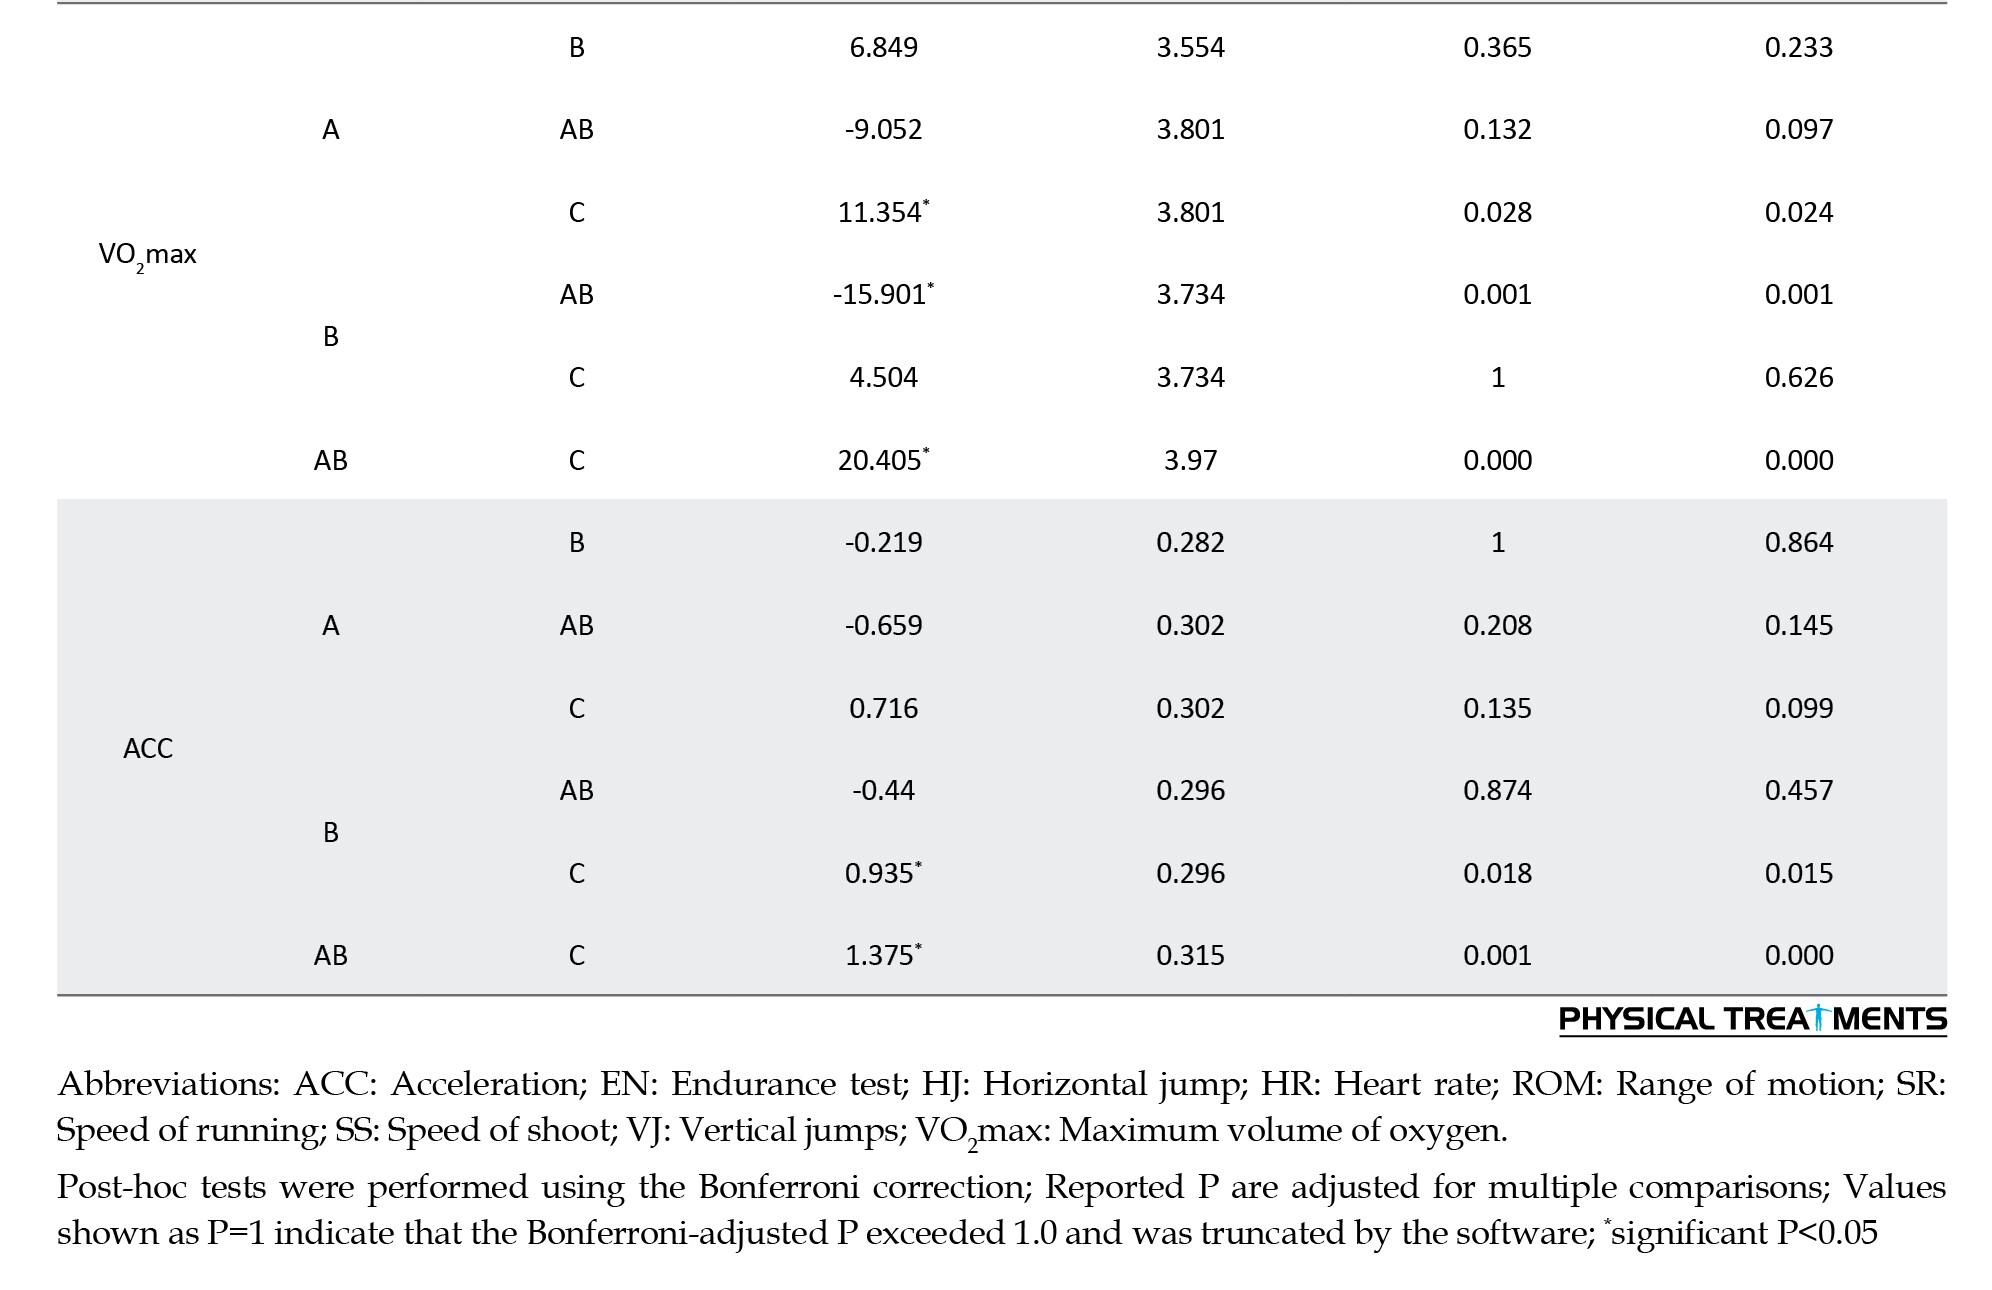
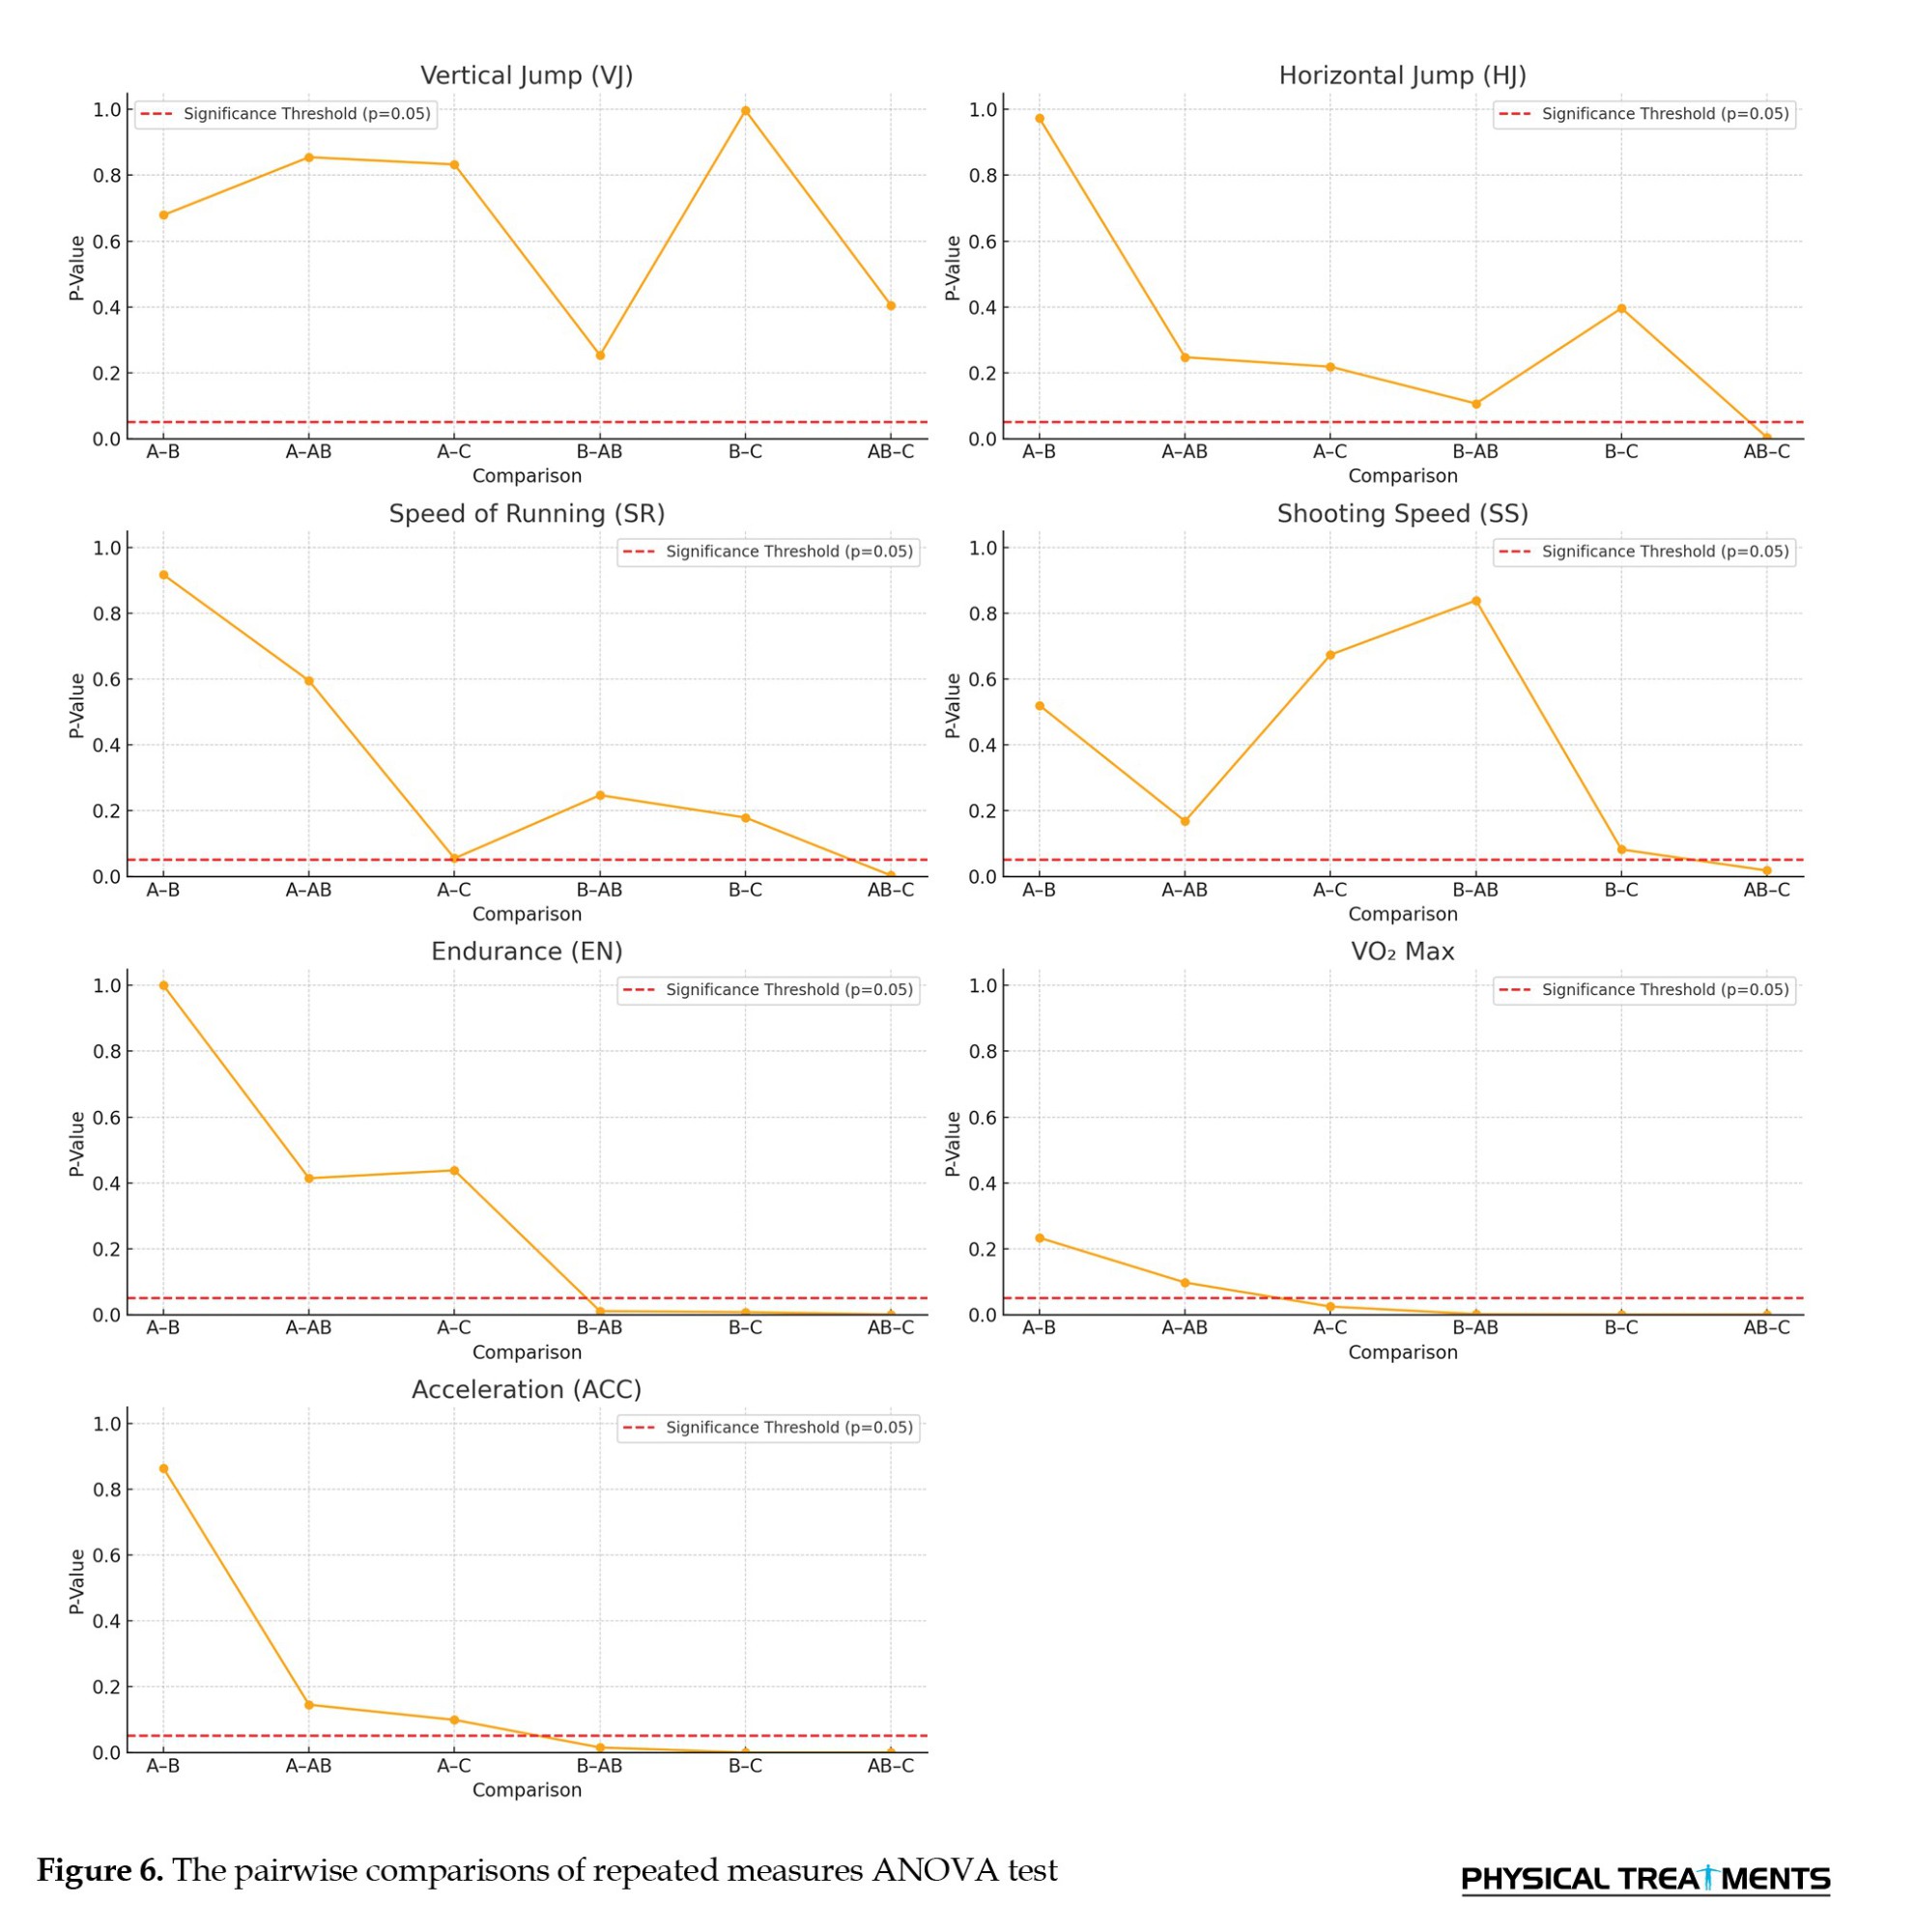
A comparison between groups is presented in the abovementioned graphs using post-hoc testing for all variables. Group comparisons are represented by the horizontal axis (x-axis), and the P is represented by the vertical axis (y-axis).
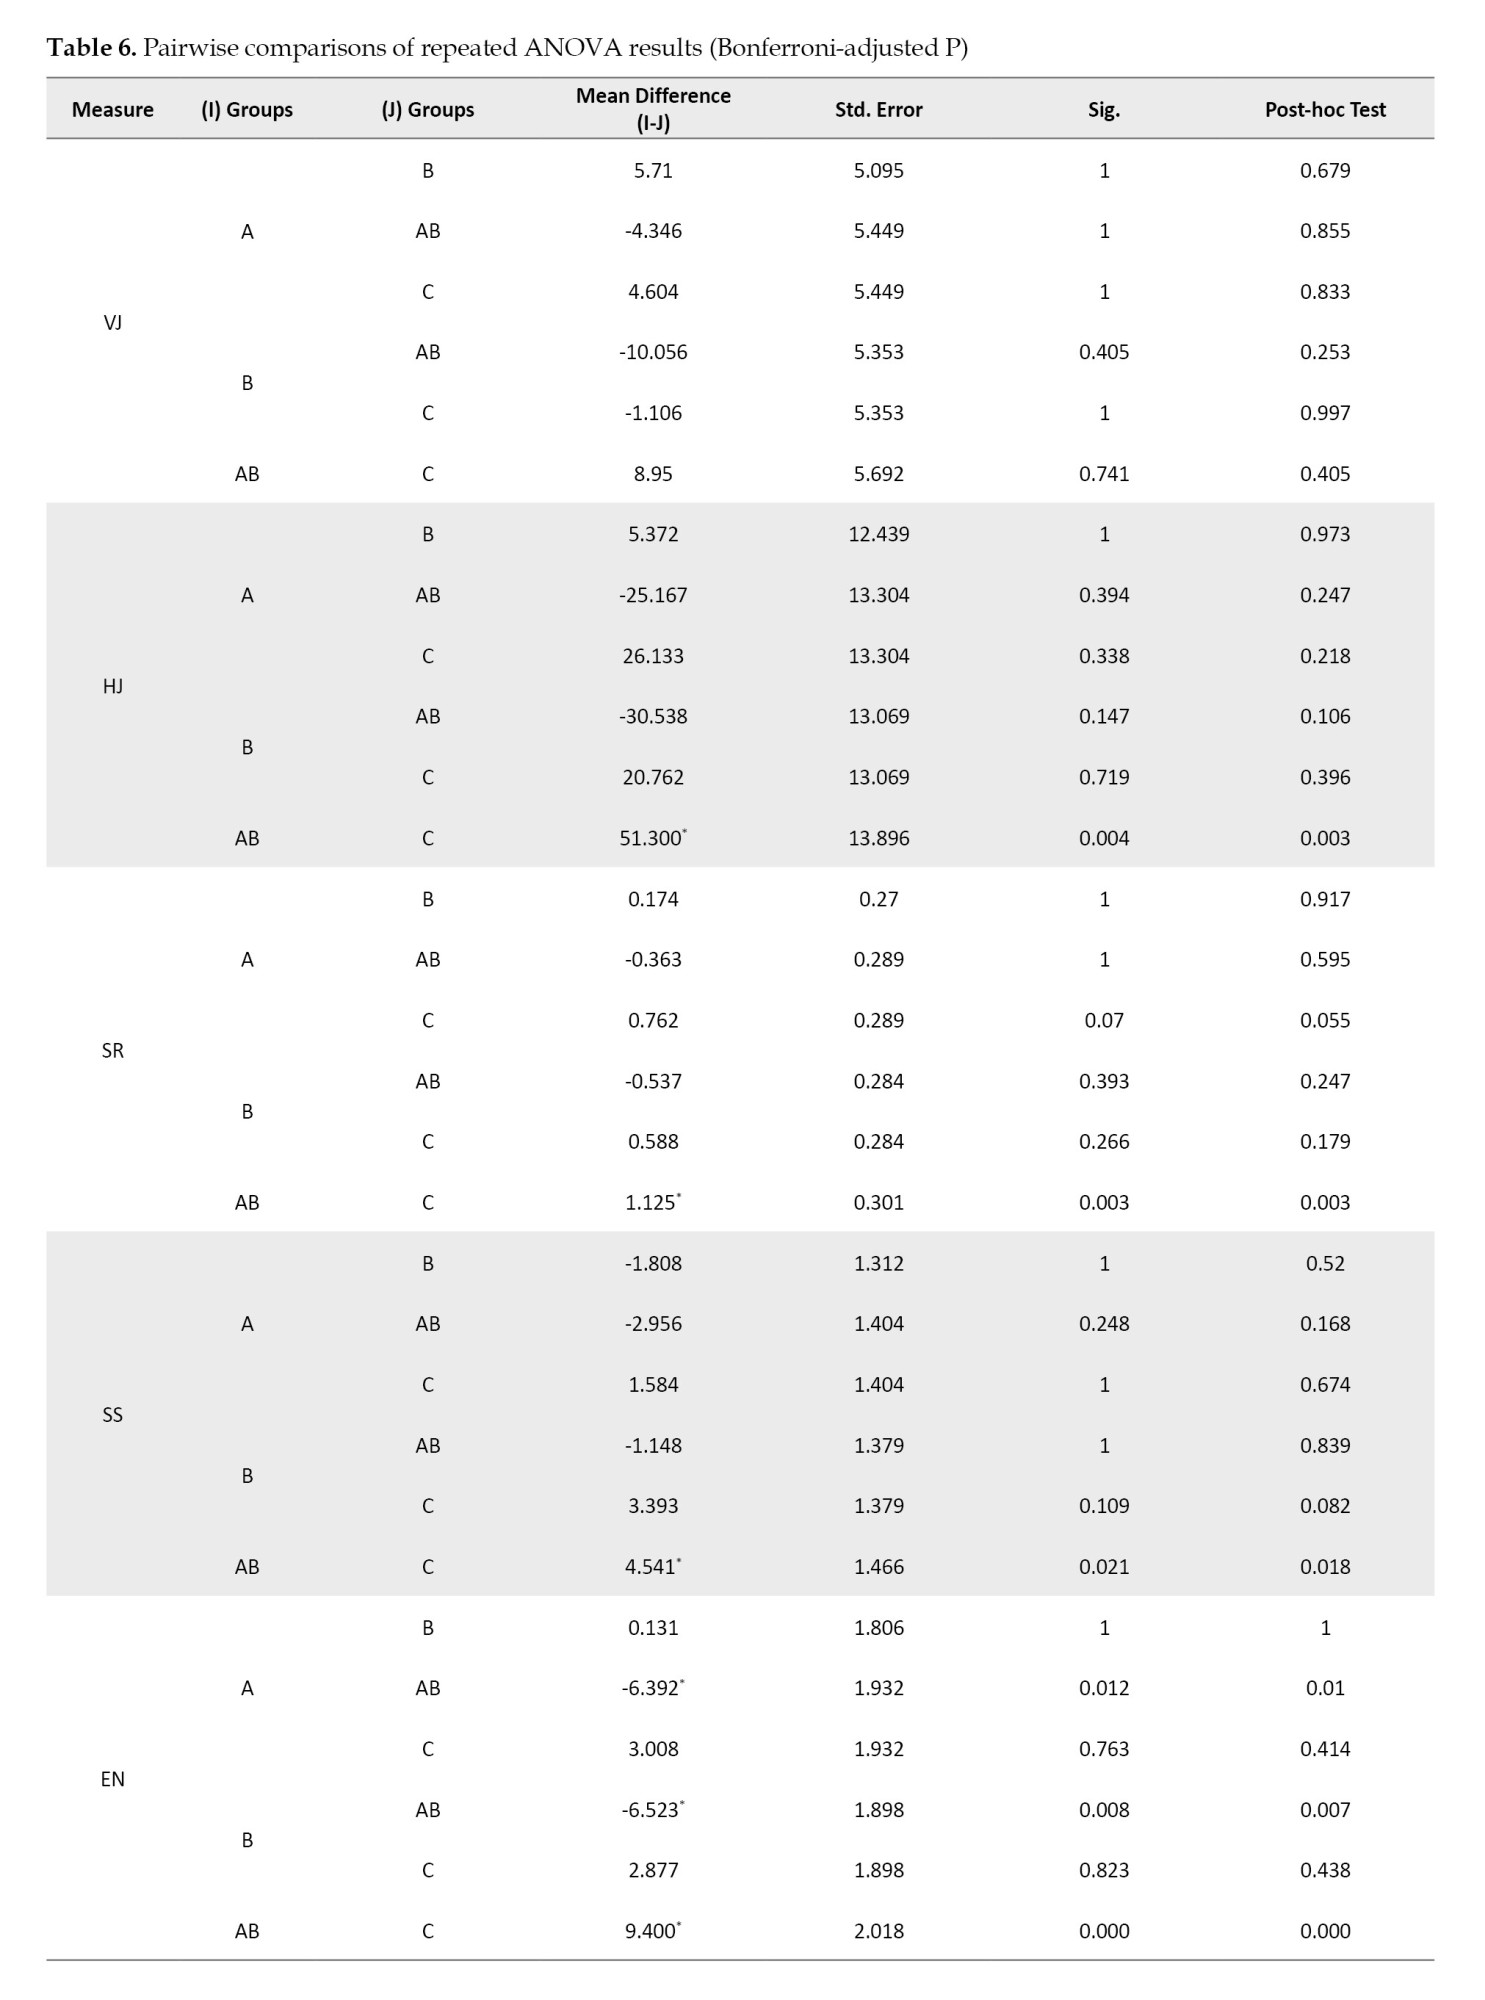
The pairwise comparison between groups, on the other hand, revealed that the participants in Group AB improved more significantly than those in the other groups. Table 2 shows that Group AB differed significantly from Group C in the HJ, RS, SS, endurance VO2max, and ACC variables (P<0.05). Similarly, for endurance and VO2max, Group AB outperformed Groups A and B. Moreover, Group A outperformed Group C in terms of RS and VO2max, and Group B outperformed Group C in ACC. These findings were confirmed using a post-hoc test (Table 5, Figure 6).
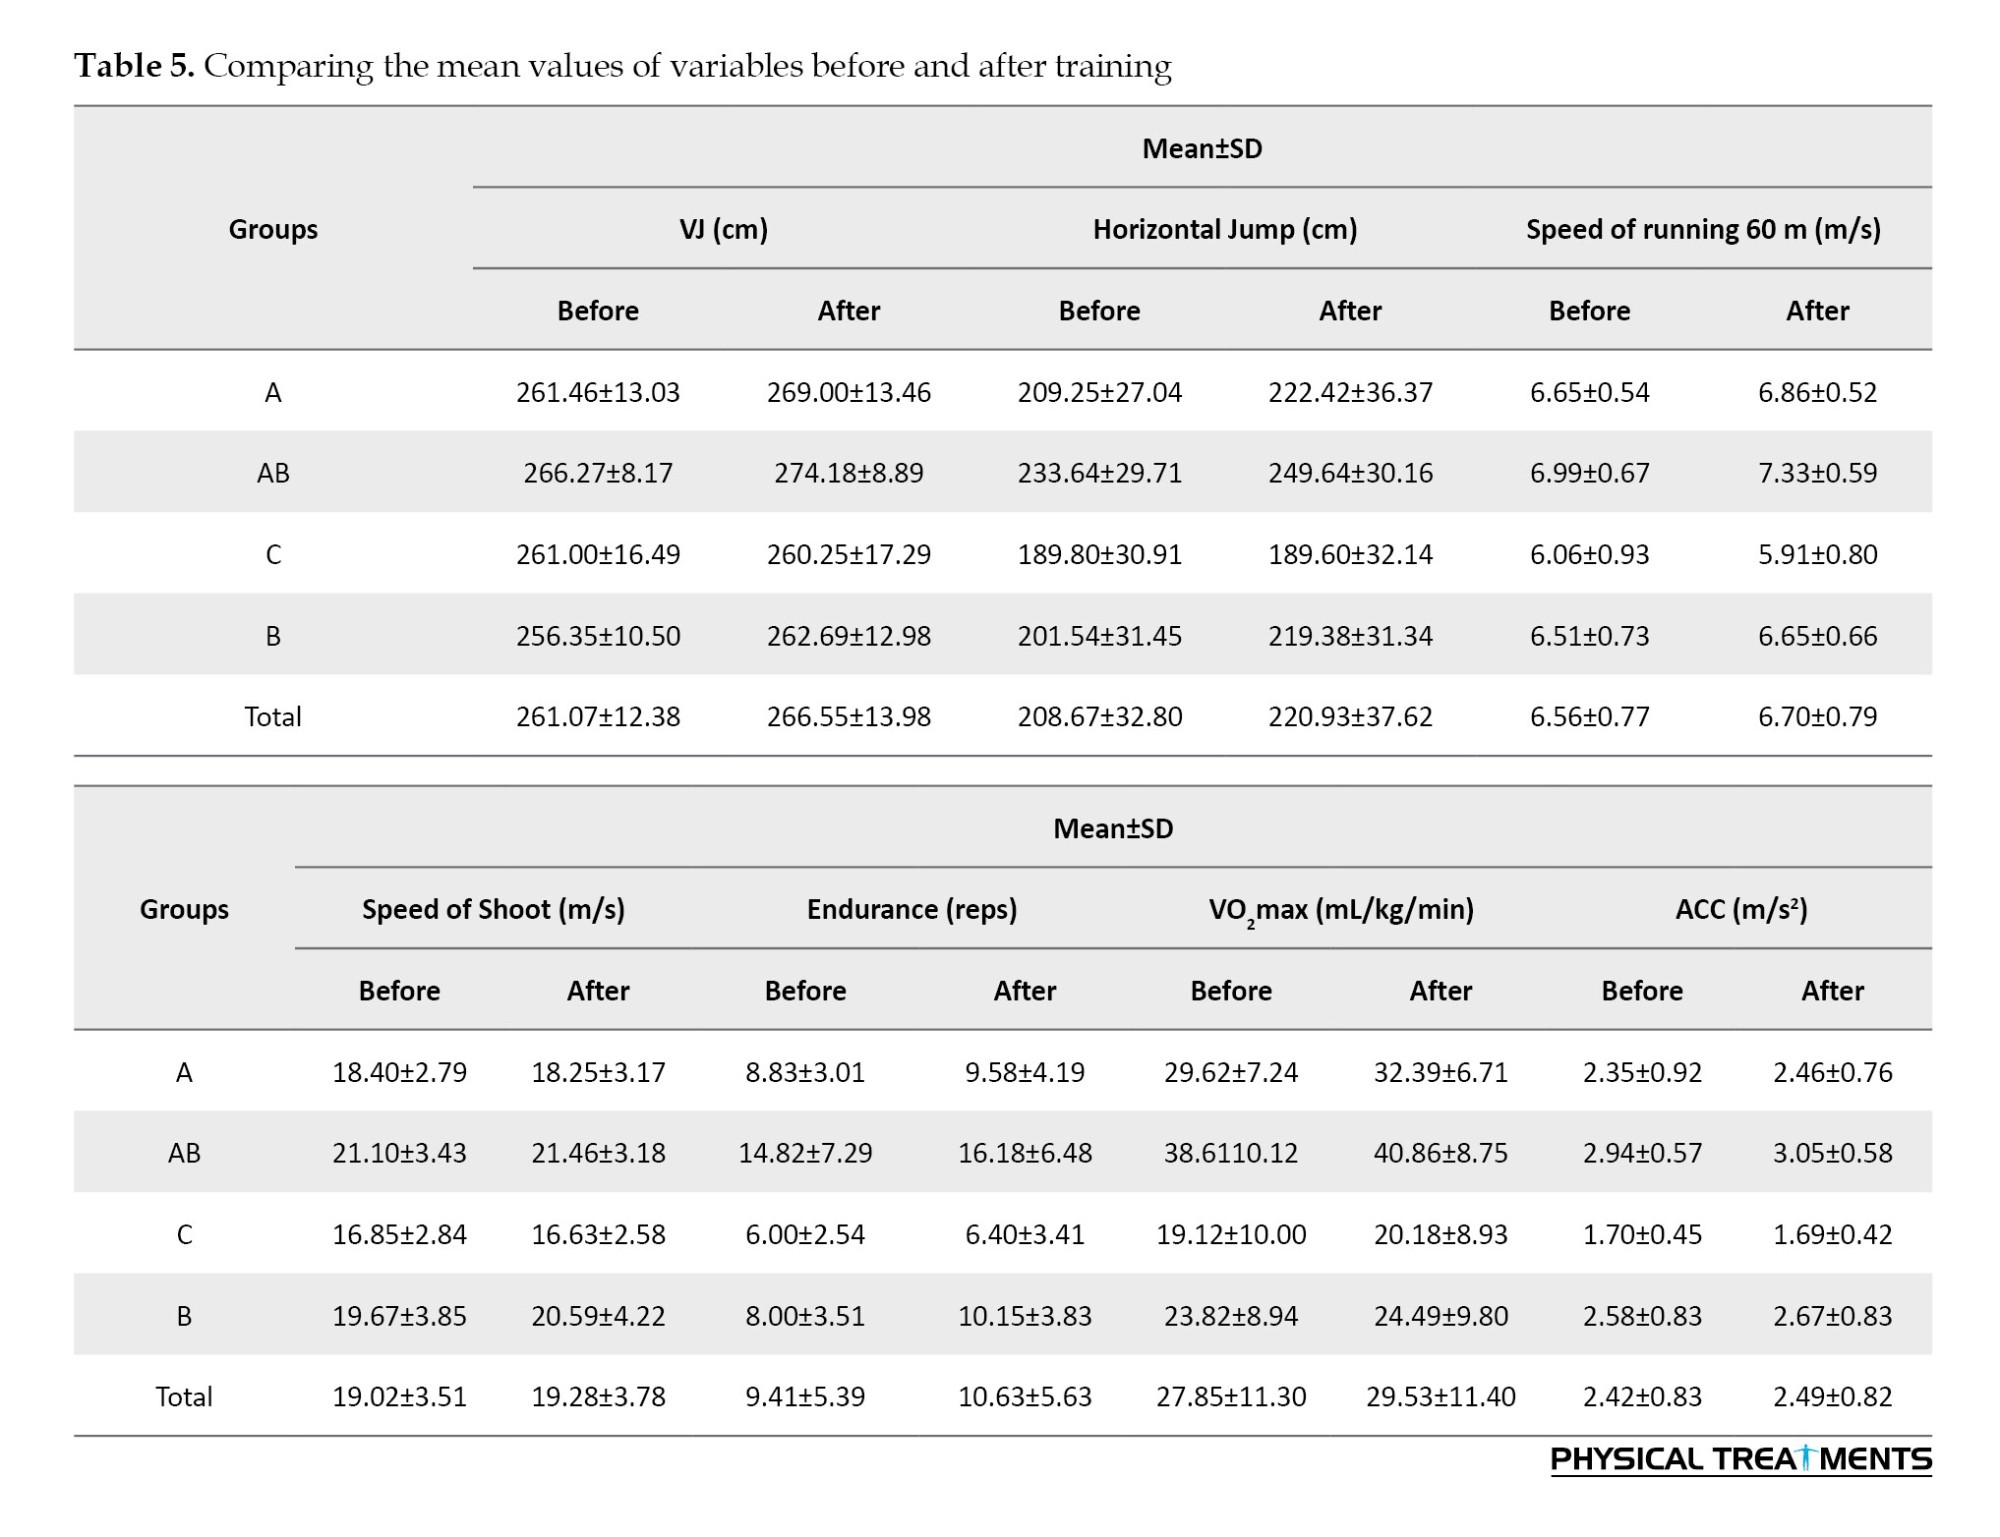
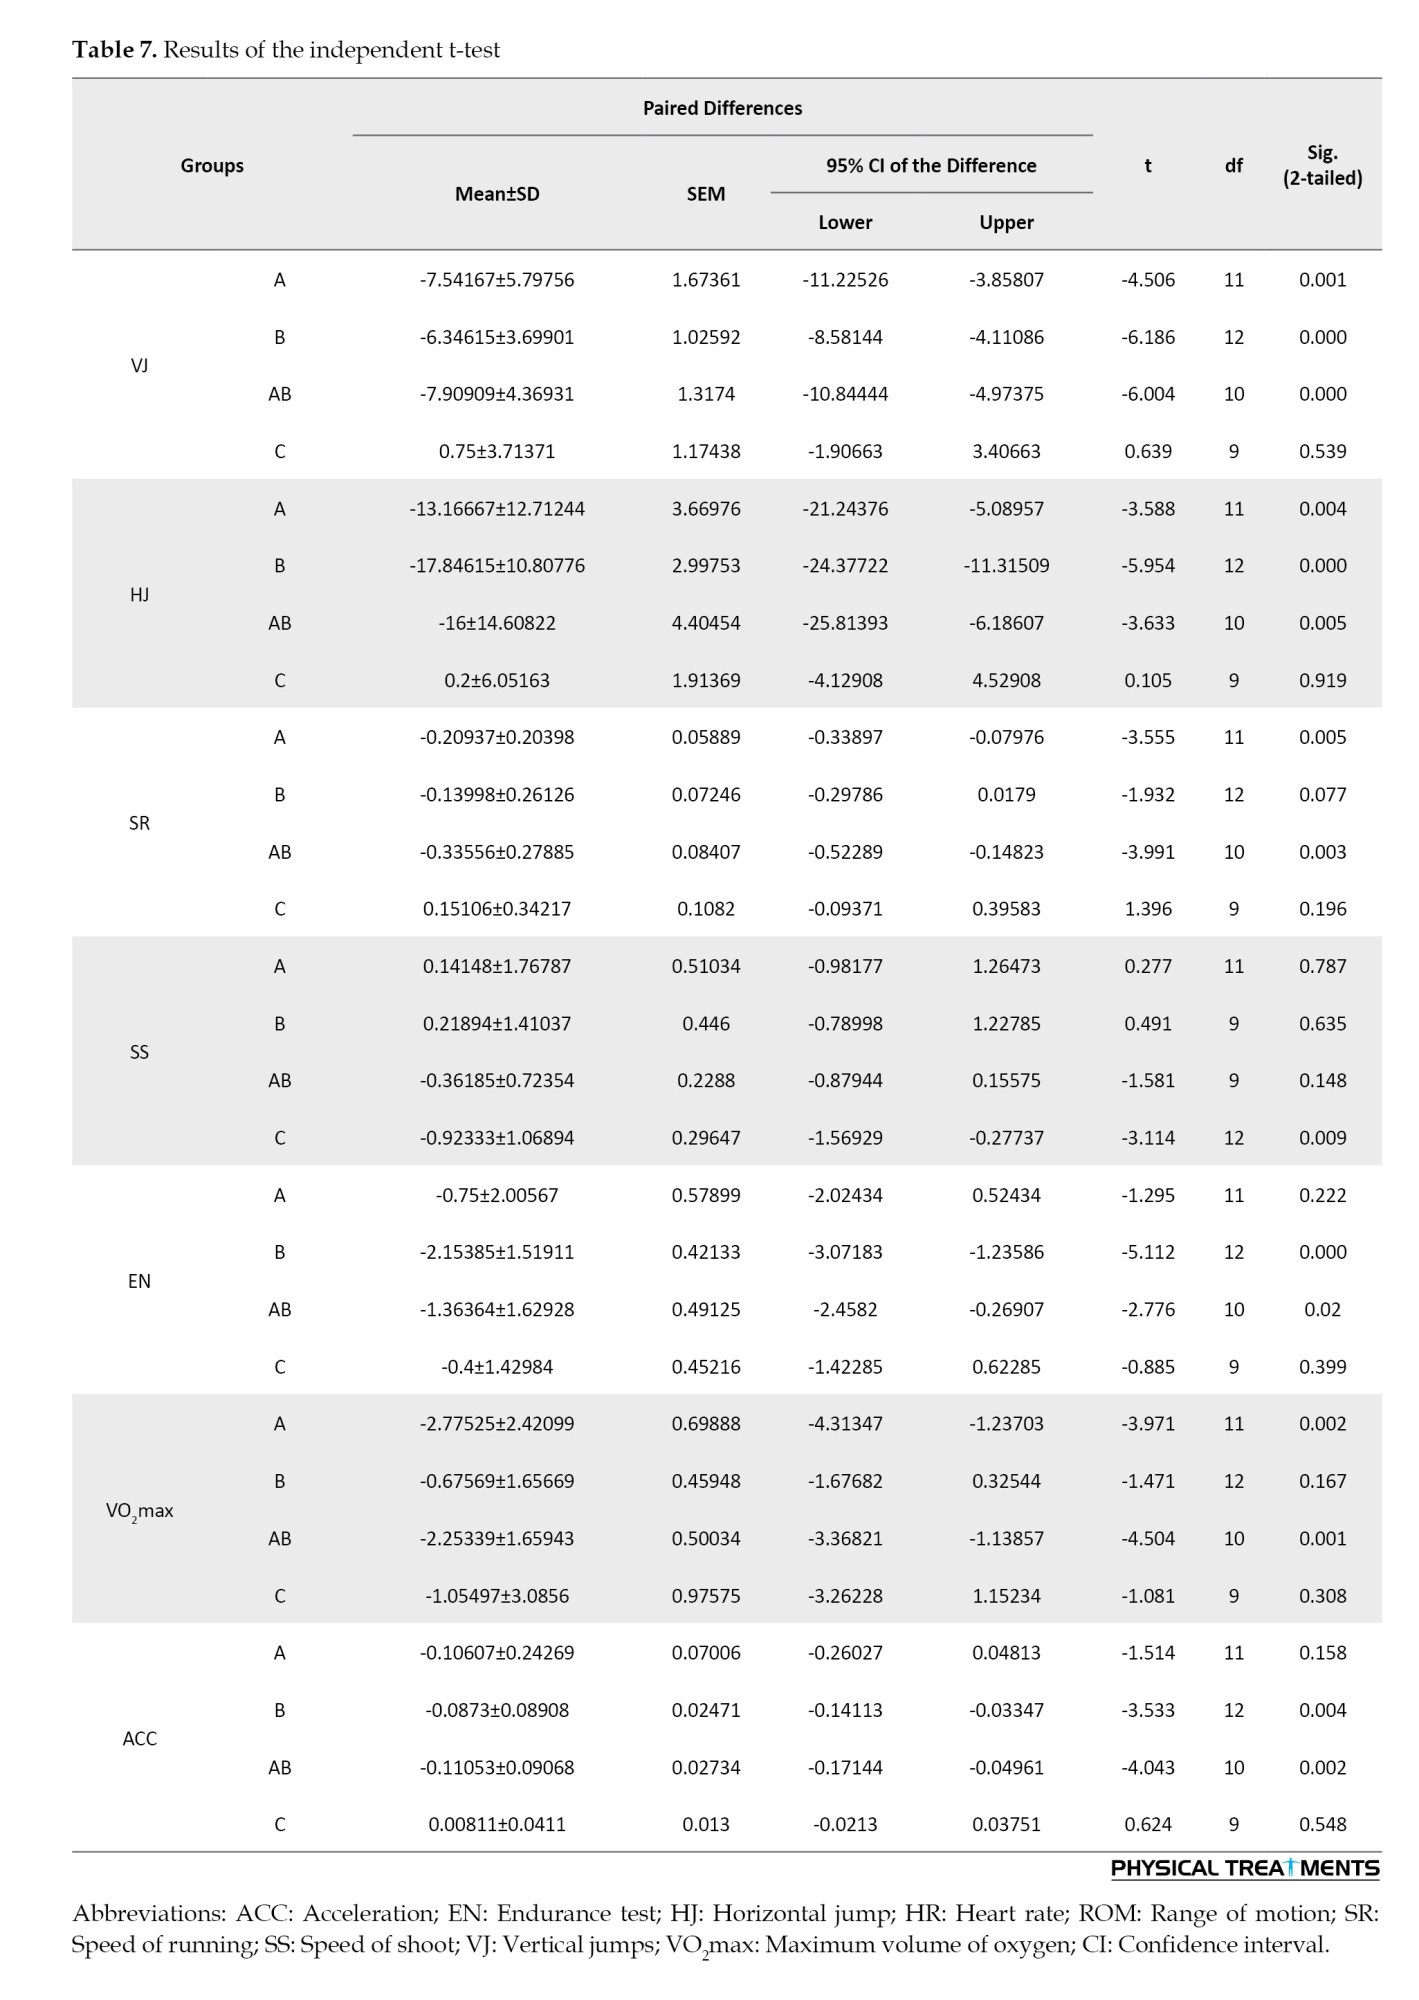
The independent t-test, which was used to assess the significance of the improvement in all variables in all groups by time effect (before and after), revealed that the SS and HR variables did not change significantly in any of the intervention groups. In contrast, all other variables improved significantly in the post-intervention assessment (P<0.05) (Table 7).
Discussion
To avoid any negative impact of sports injuries on players’ health and future [57], the training protocol of football players must be a comprehensive strategy that considers all patterns of sports performance. Accordingly, the use of strengthening and stretching exercises has been widely studied and is widely recommended for football players before and after injuries, as well as in competition preparation. The primary objective of this study was to assess the effects of combining static stretching with dynamic high-intensity resistance exercises on the performance of novice football players. This was verified by comparing it with DHIRT alone and SSE alone.
The findings of the current study show that using DHIRT alone (Group A), SSE alone (Group B), or the combination of both techniques (Group AB) had a positive impact on the jumping performance and running capacity (speed, ACC, and endurance) of novice football players, with a preference for Group toward the others. The small, non-significant difference in the effects of both protocols (A and B), with a preference for Group A, seems to be attributed to an increase in lower extremity explosive forces, which improves the ability to perform higher and longer jumps, as well as better running practice. Similarly, the non-significant superiority of Group AB over the other intervention groups (A and B) could be attributed to the number of exercises received by participants in each session, as well as the fact that adding SSE to the protocol may increase elasticity and decrease expected muscle stiffness after strengthening and prepare the muscle to generate a higher rate of force at a very specific moment.
Previous studies reported a positive impact of maximal and submaximal dynamic resistance training [2, 58] and SSE of lower limb muscles improve jumping performance [59–61], and running abilities (speed, endurance and ACC) [1, 20, 62, 63]. The authors of the current study attribute the improvement in jumping and running abilities in groups A and AB to the role of muscle strength in increasing maximum propulsion force while running. This effect can be explained by the increased activity of fast-twitch fibers, the selective intensive activation of motor units, increased stiffness, and an increased stretch reflex of lower limb muscles [2], all of which improve the rate of force development. This is particular crucial in sports that require high jumping and explosive force abilities. Additionally, Alikhajeh et al. stated that warm-up stretching could improve the ACC of novice soccer players [64], which the current study found in groups B and AB. The authors proposed that static stretching may improve muscle contractility and reduce the risk of stiffness-related injuries; however, previous studies have failed to provide a consensus on the optimal stretching protocol (i.e. duration and placement in the session).
Moreover, despite various studies emphasizing the superiority of dynamic stretching over static stretching in terms of jump performance, several authors have reported that muscular performance was unaffected after static stretching [65–67]. Our findings are consistent with those of previous studies showing that SSE improves jump performance and running ability. The decrease in VJ performance after SS was attributed by Hough et al. to a possible change in the viscoelastic properties of the muscular tendon unit (MTU) [68]. Similarly, Gelen et al. and Young and Behm reported the negative impact of SSE on vertical and HJs, respectively [20, 69]. Thus, the authors highlight the need for further studies to emphasize the real impact of static and dynamic stretching on football players’ performance.
However, the results showed a significant difference over time only between the AB and C groups in shot speed. These findings are consistent with those of Skoufas, who reported that shot speed is dependent not only on muscle force but also on kicking technique [70].Additionally, Workman reported that stretching exercises did not affect football players’ SS [71]. The authors of the current study suggest that combining SSE and DHIRT may lead to better improvements in the speed of 15-meter shot by triggering the active ROM and the strength of hip flexors and knee extensors.
Moreover, consistent with previous research [72–74], a marginally significant improvement was observed in VO2max in groups A and AB. Hepple et al. suggested that the increase in VO2max after resistance training can be attributed to the growth of small vessels, which leads to the ACC of oxygen circulation in the blood and its transport to body cells [75], raising the myoglobin concentration and activating various enzymes in the muscles [76]. Furthermore, our results confirm that stretching does not increase the maximum oxygen consumption, as previously stated by Mojock et al. [74].
Beyond statistical significance, the observed improvements have substantial practical implications for football performance and injury prevention, particularly in novice players. For example, a 7.9 cm increase in VJ height may enhance a player’s ability to win aerial duels, execute powerful headers, and improve explosive movements, such as take-offs and rapid direction changes. Similarly, even small gains in ACC and sprint speed, on the order of tenths of a second, can provide a competitive advantage in high-speed, short-distance actions that frequently occur during matches. A 5.83% increase in VO₂ max suggests better aerobic fitness, which may help players maintain intensity throughout the game and recover more efficiently between efforts. Additionally, the 16 cm improvement in HJ distance reflected a significant gain in horizontal power and neuromuscular control, which are essential for sprinting, lateral movements, and quick stops or starts. Improved HJ performance is also linked to a reduced risk of injury, particularly for non-contact lower-limb injuries such as ACL tears, due to enhanced eccentric control and improved landing stability. Together, these functional outcomes indicate that the combined training intervention not only boosts performance but may also contribute to increased resilience and reduced injury risk in adolescent football players.
Conclusion
Six weeks of DHIRT combined with SSE, performed four times per week, led to significant improvements in several football-related performance variables, including vertical and HJs, RS, and VO₂ max, indicating enhanced athletic readiness in novice players. These findings support the use of a moderate-to-high intensity resistance training protocol (60–80% of 1RM) in combination with static stretching; however, further research is needed to determine the most effective intensity thresholds within this range.
From a practical standpoint, coaches working with adolescent football players should consider incorporating these combined protocols into their regular training schedules. A feasible implementation could involve two to four sessions per week, with resistance training performed at 60%–80% 1RM and 15–30 minutes of static stretching targeting major lower-limb muscle groups, scheduled either before or after resistance exercises based on logistical preference.
This study has some methodological limitations that offer valuable avenues for future investigations. Comparative trials examining diverse combinations of stretching and resistance training protocols are warranted to delineate their specific effects on athletic performance and the risk of injury. Although the current sample size was adequate for preliminary analysis, a larger and more heterogeneous cohort would improve the generalizability of the results. Additionally, the timing and duration of static stretching within combined interventions, such as pre-versus post-exercise application and variations in stretching length, should be systematically evaluated. Future research should also address potential selection bias inherent in digital recruitment, standardize control group activity levels, and employ more precise assessment tools (e.g. electronic sprint timing). Finally, although the proposed mechanisms, such as fast-twitch fiber recruitment and muscle-tendon elasticity, are theoretically grounded, they were not directly assessed due to logistical constraints. Incorporating neuromuscular and biomechanical measurements (e.g. electromyography, motion capture) is essential for validating the underlying physiological adaptations.
Ethical Considerations
Compliance with ethical guidelines
This study was approved by the Ethics Committee of University of Sciences and Arts in Lebanon, Beirut, Lebanon, and written informed consent was obtained from the participants and their guardians.
Funding
The paper was extracted from the BA thesis of Hussein Ziab, approverd by, University of Sciences and Arts in Lebanon, Beirut, Lebanon.
Authors' contributions
Conceptualization, supervision and data analysis: Hussein Ziab; Data collection: Hani Deeb and Hassan Deeb; Funding acquisition and resources: Rami Mazbouh Methodology, investigation, writing the original draft, review & editing: All authors.
Conflict of interest
The authors declared no conflict of interest.
Acknowledgments
We acknowledge all the coaches and personal trainers who participated in this study.
References
Several studies have evaluated the impact of various training protocols on football players’ performance and injury risk. Stretching and resistance training are two vital techniques that have been widely studied and recommended as key components of a training session, either before competition or after a sports injury, due to their impact on speed and force generation, which are crucial issues in competitive sports [1, 2].
Static stretching exercises (SSE) are commonly used in many warm-up protocols [3, 4], especially in sports that require flexibility. Static stretching involves positioning the joints or limbs so that the muscles and connective tissues are stretched to their maximum length. Stretching should last 15-30 seconds [5]. However, no agreement exists in the literature on the true effect of SSE; several authors have recommended using SSE to lightly increase flexibility joints range of motion (ROM) (studies reported minimal increase in the ROM after SSE) [6, 7] and reduce the risk of injuries [8, 9], as well as influencing several performance variables, such as sprinting [10, 11], jumps [12, 13], football skills (e.g. kicking and striking) [14], balance, and reaction time [15, 16]. SSE, on the other hand, has been shown in recent studies to hurt athlete performance by reducing strength [17–19], force [17, 18, 20], and speed [21]; however, it does not reduce the risk of injury [8, 22, 23]. Therefore, it should be avoided during warm-up routines [17, 18]. Deficits in muscle force have usually been attributed to delayed onset muscle soreness and damage to contractile proteins in skeletal muscles [24].
Strength exercises, on the other hand, have been shown in several studies to improve the performance of football players [25–27]. In a highly competitive sport, the primary goal of strength training is to improve players’ specific and relevant athletic performance inherent to their sport. In this context, different variables must be considered when designing a resistance training protocol; one of the vital factors that has been extensively studied is the load. Research indicates that lower extremity strength training protocols, either low-load with high repetition and high velocity training (10-30% one-repetition maximum [1RM]) [28, 29] or maximal or supramaximal loads (120-150% 1RM) [30, 31], are effective in improving football players’ sports abilities. Accordingly, the authors of the current study used dynamic high-intensity resistance training (DHIRT), which involves applying loads between 60-80% of an individual’s 1RM, and has been linked to significant neuromuscular adaptations [32]. These include increased rate of force development, improved motor unit synchronization, and enhanced muscle fiber recruitment, particularly in type II (fast-twitch) fibers [33].
The selection of 60–80% 1RM in this study was deliberate: This range is known to be effective in enhancing both muscular strength and power without posing excessive risk to adolescent participants [32]. It also distinguishes the protocol from low-load endurance training or hypertrophy-focused programs, making it more relevant to football-specific skills, such as sprinting, jumping, and directional changes.
The authors suggest that when combined, DHIRT and SSE offer both structural and functional benefits, potentially leading to enhanced power output, endurance, and mobility in young athletes. However, to the best of our knowledge, no previous studies have addressed the combination of SSE with DHIRT in the training of novice football players.
Against this backdrop, this study aims to bridge the critical gap in the literature by investigating the combined effects of SSE and DHIRT on the performance of novice football players. In our study, novice players are defined as male adolescents aged 15-18 years who had participated in structured football training for less than three months, with no previous engagement in strength training or competitive-level football. Additionally, these participants did not exceed two football sessions per week in the six months preceding the study. This definition aligns with the criteria used in developmental training research [34].
The novelty of this study lies in its exploration of the synergistic impact of these two training modalities, shedding light on potential benefits or drawbacks that may emerge when employed concurrently. This study aims to contribute valuable insights into the field of sports science by informing training protocols tailored specifically to the unique needs of novice football players. Through an in-depth analysis over a 6-week training cycle, we aimed to elucidate the complex impact of stretching and strength exercises on key performance variables of football players.
Materials and Methods
Design
This single-blinded RCT was conducted to evaluate the effects of DHIRT, SSE, and their combination (DHIRT+SSE) on football-related performance metrics in novice male football players. The assessors were blinded to group allocation to reduce bias. This study adhered to the CONSORT guidelines for reporting clinical trials and was conducted between November and December 2023.
Participants
A Google Form, in which the aims and methods of this study were described, was sent via WhatsApp and email to young male teenagers between the ages of 15-18 years in different football academies across Beirut [35]. To determine whether the applicant was qualified to participate, demographic characteristics (age, weight, height) and specific information about their sports performance (i.e. duration of football practice and strength training bodybuilding) were collected.
Participants were selected according to the following criteria:
1) Novice male football players who had been training for less than 3 months [34]. 2) No history of musculoskeletal injury in the last 6 months. 3) No other health-related problems (i.e. cardiorespiratory or systemic problems) that might affect their sports performance.
Participants who were unable to attend the whole protocol, missed more than two consecutive sessions, or refused to sign the informed consent form were excluded.
To ensure baseline equivalence across groups, independent sample t-tests were conducted for all performance variables before the intervention, confirming no statistically significant differences (P>0.05) between groups at baseline.
Sampling and allocation concealment strategies
A priori power analysis was conducted using G*Power software, version 3.1.9.7 to determine the required sample size for this RCT. A pilot study involving five novice football players in each Group (SSE and DHIRT) provided initial data on multiple performance metrics. For each variable, we calculated the mean difference, pooled standard deviation, and Cohen’s d to estimate effect sizes (ES). Using a significance level of α=0.05 and power of 0.80, the required sample size for each outcome was determined.
To ensure adequate statistical power across all outcomes, we adopted a conservative approach using the largest sample size estimate among all calculated metrics (12 participants per group) as the basis for recruitment. This decision was made to ensure that the study was sufficiently powered to detect meaningful differences, particularly for variables with small ESs. For full details of the power analysis and calculations, please refer to Appendix 1.
Subsequently, all eligible participants were randomly assigned to groups using a concealed allocation process. Group assignments were determined using a computer-generated randomization list and concealed in sealed, opaque, sequentially numbered envelopes prepared by an independent researcher who was not involved in recruitment or assessment. Envelopes were opened only after participants were confirmed eligible, ensuring unbiased group allocation. The groups were as follows: A (DHIRT), B (SSE), AB (combined DHIRT and SSE), and C (control) (Figure 1).
Outcome measures
The football-related skills refer to the ability to perform a motor task with maximum accuracy and minimum energy or time [36]. Accordingly, different variables were assessed in this study, including jump abilities (vertical and horizontal), running abilities (speed, endurance, and acceleration [ACC]), shooting speed (SS), joint mobility, and physiological parameters after effort (maximum oxygen volume [VO2max] and heart rate [HR]).
To reduce the risk of injury, each participant received a 10 to 15-minute warm-up session before the evaluation. The training included jogging, running with and without the ball, as well as stretching exercises for the hamstrings, quadriceps, and triceps muscles. It is worth noting that the tests were conducted outdoors on artificial grass under dry and warm conditions.
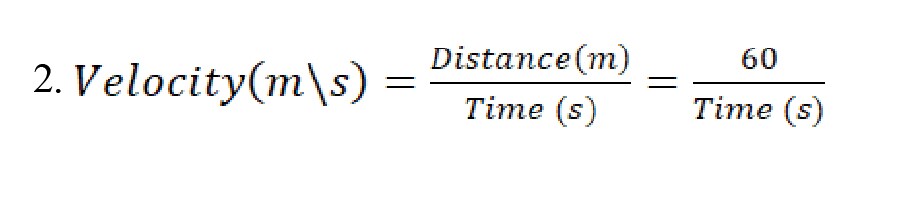
Shoot speed test
Shooting refers to the attempt to score a goal by striking the ball with speed, strength, or accuracy. With sneakers suitable for soccer and using Gabonese football (Conti, circumference of 69.0 cm and mass of 440 g), the assessors asked the participants to shoot the ball at the center of the goal, which was 11 m away, using the foot that they felt was most suitable to successfully complete the task. The test was repeated thrice, and the time of the fastest kick was recorded. Each player was given a minute break between the kicks (Figure 2).
A video camera (SonyTM, HDR-PJ20, Japan) with a maximum resolution of 1920 x 1080 px was placed near the imaging area (VC, Figure 2), and time was counted from the moment the participant’s foot touched the ball until it reached the goal line [37]. Using the free online “Kapwing” program, the video of each shoot was slowed to a minimum speed, and the first time the player’s foot reached the ball was logged, as well as the time the ball crossed the goal line. The total time spent between the two times was then computed. The time displayed on the screen was used as a guide for the measurements. The speed was then measured using the Equation 1:
where velocity is measured in m/s, and time is extracted from videos in seconds, and the distance is constant for all trials (11 m) [38].
It is worth noting that, according to Murray et al. this method of evaluating RS using 2D video-camera analysis is a reliable technique for measuring speed, with an intraclass correlation coefficient (ICC) of 0.98 [39].
Endurance
Athlete endurance refers to the ability of an athlete to perform work over an extended period. The “multistage fitness beep test” is a reliable measure of endurance in sports activities; it is a multistage fitness test (MSFT) commonly used as a maximum aerobic fitness test [40] (Figure 3).
This test entails running continuously between two cones 20 m apart at an appropriate time. Participants began by running at a pace that allowed them to cross 20 meters in five seconds, and then they switched directions when instructed by the assessor. If a participant did not reach the line within 5 s, they received a warning and were required to continue running to the line. Following the second warning, the data were recorded by the number of times the participants successfully crossed the line [41].
The RSs
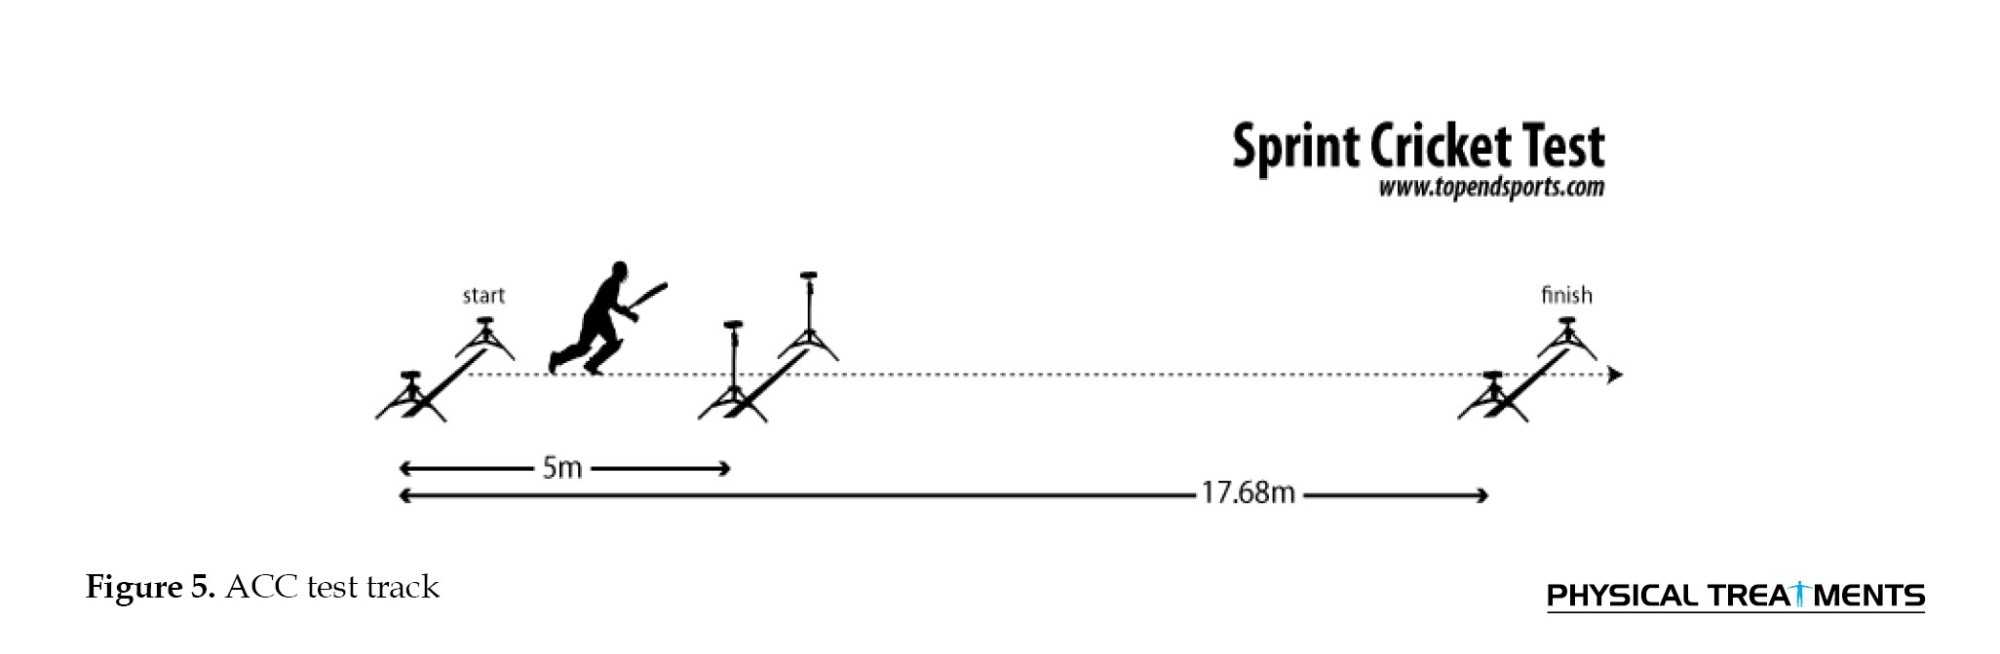
The time taken to run 60 m was computed using an adequate chronometer (Ociodual Chronomètre XL-013) (Figure 4).
The RS was then determined using the Equation 2 [38, 42]:
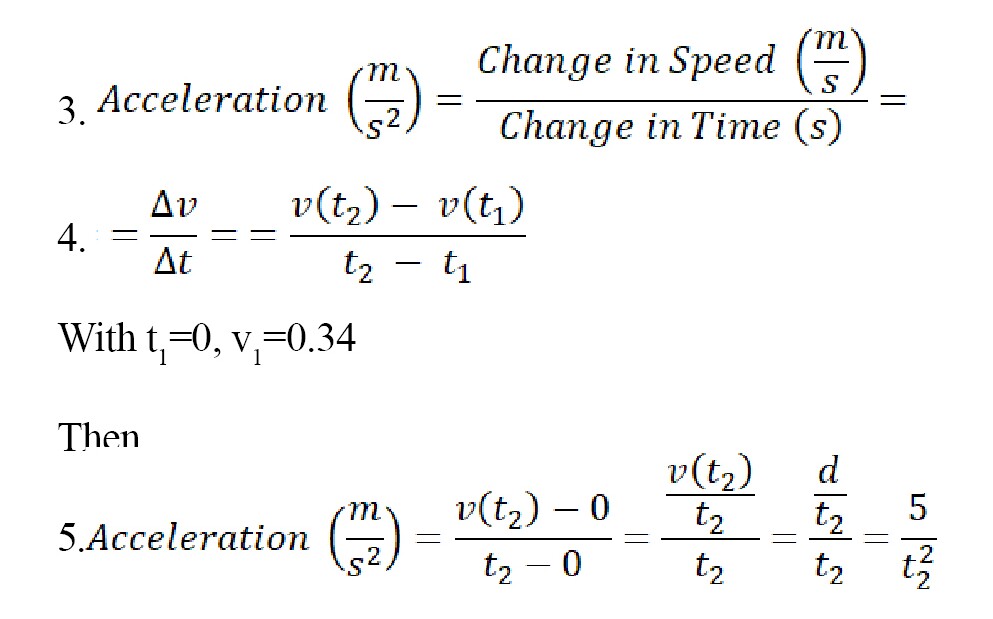
ACC
ACC performance is critical for athletes in sports that require a high level of repeat sprint ability [43], such as football. The rate of change in velocity is defined as ACC. In practice, however, ACC ability is often referred to as sprint performance over shorter distances, such as 5 m or 10 m. It is measured using sprint time or velocity, particularly among applied sports scientists and coaches.
In the current study, the time spent running 5 m was measured using a digital camera (Sony, HDR. -PJ260, Japan) positioned in the middle of two cones; the first cone was placed at the starting point, and the second cone was placed 5 m away on a 60-m running track. The time was extracted from the video recording using “Kapwing” software. Due to the stability before starting the run, the initial time and speed were considered zero [34]. The ACC was then calculated using the Equations 3, 4 and 5:
With t1=0, v1=0.34
Then,
ACC was measured using video-based timing, which has been validated in previous studies with ICCs exceeding 0.90 when the camera position and frame analysis were standardized [44] (Figure 5).
Vertical and horizontal jumps (HJ)
The vertical jump (VJ) is a test of lower-body strength. Sargent’s jump test was performed using a measuring tape attached to the wall. The participant stood close to the wall, with the shoulder fixed at 180° and the elbow fully extended. The athlete jumps vertically at the highest possible level and marks the tape. The distance between the athlete’s standing reach height and jumping reach height was recorded. The test was repeated three times and the highest jump was considered [45, 46].
The HJ or long jump is a common and easily managed test used to assess explosive leg strength. A measuring tape was used to measure the distance travelled, and a two-foot take-off and landing was used, with arms swinging and knees folding to provide forward oscillation. The participants were instructed to jump as far as possible and land on both feet together. They were asked to make three attempts to choose the most far-reaching distance [46].
These methods have shown high reliability in adolescent populations, with reported ICC of 0.91–0.97 [47].
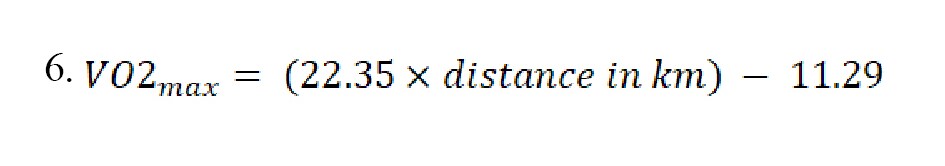
Maximum oxygen rate
Maximal oxygen uptake is considered the best indicator of aerobic capacity and maximal cardiorespiratory function [48]. It refers to oxygen consumption during stress tests or when exercising hard [42].
It is a measure of fitness in terms of an individual’s ability to tolerate long periods of moderate-to-vigorous physical activity. As a result, a 12-minute Cooper race test was used as a valid and reliable measure of maximum aerobic fitness, with a minimal standard error of estimate (SEE=0.193 mL/kg/min) [49]. It entails asking participants to move as far as they can in 12 minutes and then to record the total distance traveled [50, 51]. Consequently, VO2max is measured using the Equation 6:
6.
Procedures
Following randomization, participants completed 24 supervised training sessions between November 8 and December 15, 2021. Certified strength and conditioning specialists conducted all sessions, each holding at least a bachelor’s degree in physical education and prior experience working with adolescent athletes. To ensure methodological consistency, all trainers were thoroughly briefed and adhered to a standardized intervention protocol, covering exercise technique, load progression, session timing, and instructional delivery. To minimize variability, each trainer was assigned to the same Group throughout the intervention. The final group allocation was as follows:
Group A
The term “high intensity” in this study refers to resistance loads prescribed at 60–80% of the estimated one-repetition maximum. 1RM was estimated using the Brzycki formula [52], a submaximal prediction method validated for use in adolescent populations. This intensity range is consistent with the recommendations of the National Strength and Conditioning Association and the American College of Sports Medicine for high-intensity resistance training in youth [34, 53].
Participants in the DHIRT group followed a push–pull–legs split program, performed four times per week for six weeks. A progressive linear loading model was used, beginning at 60% of estimated 1RM in the first week and increasing gradually by approximately 5% each week, reaching 80% of the 1RM by the final training phase. Load adjustments were made based on weekly performance reassessments and participant feedback, ensuring both progressive overload and safety. The 1RM estimates were updated mid-protocol to accommodate strength gains. All training loads were individualized by muscle group based on the initial strength assessment [33] (Table 1).
Each session began with a 5-minute general warm-up, consisting of running on a treadmill, followed by a very light free-weight warm-up (<20% of RM). Subsequently, one hour of DHIRT was applied.
Group B
Group B consisted of a protocol of SSE of the gross muscles of the whole body with a higher focus on the muscles of the lower extremities (Table 2).
It is worth noting that each exercise was applied for 15 to 30 s, with three repetitions per session. The athlete was instructed to lean on his back in a relaxed position and avoid unnecessary contraction or any risk of injury. In case the athlete felt any pain or unsupported tension, he was instructed to raise his hand, and the trainer immediately stopped the exercise [54].
Group AB
Given that multiple studies have demonstrated the need to design a holistic protocol that improves all aspects of training for athletes to enhance their performance, rather than focusing solely on specific approaches, such as stretching or strength training, the authors combined both protocols in group AB to examine their effect on participants, with the hypothesis that better improvement in fitness-related outcome measures will be recorded when compared to other groups.
Accordingly, the same DHIRT program used in group A was used in this group, with the same intensity and frequency for each exercise. In addition, a global muscle SSE program with a greater focus on muscle strengthening was introduced. Stretching exercises were applied immediately after the strengthening exercises in each session. Each exercise was performed twice.
It is worth noting that if any participants in groups A, B or AB missed a training session, a makeup session was held on Saturdays.
Group C
The control group was included to isolate the effects of the training interventions by providing a reference with no structured physical conditioning. The participants in this Group did not participate in any supervised training or structured exercise sessions during the study. However, they were permitted to continue their usual informal football and physical activity routines, which they had been practicing regularly before the study. This ensured that their activity levels reflected their natural baseline behavior, without introducing new training effects that could influence the outcome measures.
Statistical analysis
Statistical analyses were conducted using SPSS software, version 26 (SPSS Inc., Chicago, Illinois, USA). The normal distribution of data was examined using the Shapiro-Wilk test and Q-Q plot. In addition, an analysis of variance (ANOVA) test was used to compare participants and detect any significant differences at baseline. Moreover, descriptive statistics were calculated for the demographic data using Means±SD.
An independent t-test was used to compare pre and post-tests concerning group allocation. Moreover, comparisons between groups were performed using repeated-measures ANOVA. The level of significance was set at P<0.05. Moreover, post-hoc pairwise comparisons were conducted using the Bonferroni correction to adjust for multiple testing and reduce the risk of Type I error
ES was calculated using Partial Eta Squared (η2). The magnitude of the ESs was classified as small (0.01), medium (0.06), or large (>0.14). A P<0.05 was used to detect significance [55, 56].
Results
Descriptive analysis
Initially, 64 participants were enrolled in the study. Ten were excluded because they did not meet the inclusion criteria. Eight participants dropped out during the intervention. The analysis followed a per-protocol design, including only participants who completed the full intervention protocol and attended at least 90% of the training sessions. Dropouts were excluded from the final analysis to preserve the integrity of intervention effect estimates Finally, the outcomes of 46 participants were analyzed. The mean age, weight, and height of the participants were 16.54 years, 69.1 kg, and 174.7 cm, respectively (Table 3). Figure 1 shows the CONSORT flowchart of this study.
To validate statistical assumptions, the Shapiro–Wilk test showed that all performance variables at baseline were normally distributed (P>0.05) (Appendix 2). This was further supported by visual inspection of histograms and Q–Q plots, which indicated approximate normality across variables. Although the P for endurance at baseline was at the threshold (P=0.050), the sample size (n=46) provided sufficient robustness through the Central Limit Theorem, supporting the use of parametric tests.
Baseline comparability among groups was also confirmed: No significant differences were found in demographic variables (age, height, and weight) across the four groups (P>0.05) as assessed by one-way ANOVA (Tables 4 and 5, Appendix 3).
The repeated measures ANOVA multivariate analysis revealed significant differences between and within groups (P<0.05). Accordingly, the univariate tests revealed significant changes in all variables except SS in the within-group analysis (time comparison) and HR in the between-group analysis.
Additionally, a significant time * group interaction was observed in the within-group analysis of different variables (i.e. HJ, VJ, RS, and hip ROM), indicating the superiority of one Group over the others across time (Table 6).
Furthermore, as shown in Table 6, large ESs were reported, revealing the great impact of the three interventions on all participants in all groups (0.402 ≤η2≤ 0.827).
A comparison between groups is presented in the abovementioned graphs using post-hoc testing for all variables. Group comparisons are represented by the horizontal axis (x-axis), and the P is represented by the vertical axis (y-axis).
The pairwise comparison between groups, on the other hand, revealed that the participants in Group AB improved more significantly than those in the other groups. Table 2 shows that Group AB differed significantly from Group C in the HJ, RS, SS, endurance VO2max, and ACC variables (P<0.05). Similarly, for endurance and VO2max, Group AB outperformed Groups A and B. Moreover, Group A outperformed Group C in terms of RS and VO2max, and Group B outperformed Group C in ACC. These findings were confirmed using a post-hoc test (Table 5, Figure 6).
The independent t-test, which was used to assess the significance of the improvement in all variables in all groups by time effect (before and after), revealed that the SS and HR variables did not change significantly in any of the intervention groups. In contrast, all other variables improved significantly in the post-intervention assessment (P<0.05) (Table 7).
Discussion
To avoid any negative impact of sports injuries on players’ health and future [57], the training protocol of football players must be a comprehensive strategy that considers all patterns of sports performance. Accordingly, the use of strengthening and stretching exercises has been widely studied and is widely recommended for football players before and after injuries, as well as in competition preparation. The primary objective of this study was to assess the effects of combining static stretching with dynamic high-intensity resistance exercises on the performance of novice football players. This was verified by comparing it with DHIRT alone and SSE alone.
The findings of the current study show that using DHIRT alone (Group A), SSE alone (Group B), or the combination of both techniques (Group AB) had a positive impact on the jumping performance and running capacity (speed, ACC, and endurance) of novice football players, with a preference for Group toward the others. The small, non-significant difference in the effects of both protocols (A and B), with a preference for Group A, seems to be attributed to an increase in lower extremity explosive forces, which improves the ability to perform higher and longer jumps, as well as better running practice. Similarly, the non-significant superiority of Group AB over the other intervention groups (A and B) could be attributed to the number of exercises received by participants in each session, as well as the fact that adding SSE to the protocol may increase elasticity and decrease expected muscle stiffness after strengthening and prepare the muscle to generate a higher rate of force at a very specific moment.
Previous studies reported a positive impact of maximal and submaximal dynamic resistance training [2, 58] and SSE of lower limb muscles improve jumping performance [59–61], and running abilities (speed, endurance and ACC) [1, 20, 62, 63]. The authors of the current study attribute the improvement in jumping and running abilities in groups A and AB to the role of muscle strength in increasing maximum propulsion force while running. This effect can be explained by the increased activity of fast-twitch fibers, the selective intensive activation of motor units, increased stiffness, and an increased stretch reflex of lower limb muscles [2], all of which improve the rate of force development. This is particular crucial in sports that require high jumping and explosive force abilities. Additionally, Alikhajeh et al. stated that warm-up stretching could improve the ACC of novice soccer players [64], which the current study found in groups B and AB. The authors proposed that static stretching may improve muscle contractility and reduce the risk of stiffness-related injuries; however, previous studies have failed to provide a consensus on the optimal stretching protocol (i.e. duration and placement in the session).
Moreover, despite various studies emphasizing the superiority of dynamic stretching over static stretching in terms of jump performance, several authors have reported that muscular performance was unaffected after static stretching [65–67]. Our findings are consistent with those of previous studies showing that SSE improves jump performance and running ability. The decrease in VJ performance after SS was attributed by Hough et al. to a possible change in the viscoelastic properties of the muscular tendon unit (MTU) [68]. Similarly, Gelen et al. and Young and Behm reported the negative impact of SSE on vertical and HJs, respectively [20, 69]. Thus, the authors highlight the need for further studies to emphasize the real impact of static and dynamic stretching on football players’ performance.
However, the results showed a significant difference over time only between the AB and C groups in shot speed. These findings are consistent with those of Skoufas, who reported that shot speed is dependent not only on muscle force but also on kicking technique [70].Additionally, Workman reported that stretching exercises did not affect football players’ SS [71]. The authors of the current study suggest that combining SSE and DHIRT may lead to better improvements in the speed of 15-meter shot by triggering the active ROM and the strength of hip flexors and knee extensors.
Moreover, consistent with previous research [72–74], a marginally significant improvement was observed in VO2max in groups A and AB. Hepple et al. suggested that the increase in VO2max after resistance training can be attributed to the growth of small vessels, which leads to the ACC of oxygen circulation in the blood and its transport to body cells [75], raising the myoglobin concentration and activating various enzymes in the muscles [76]. Furthermore, our results confirm that stretching does not increase the maximum oxygen consumption, as previously stated by Mojock et al. [74].
Beyond statistical significance, the observed improvements have substantial practical implications for football performance and injury prevention, particularly in novice players. For example, a 7.9 cm increase in VJ height may enhance a player’s ability to win aerial duels, execute powerful headers, and improve explosive movements, such as take-offs and rapid direction changes. Similarly, even small gains in ACC and sprint speed, on the order of tenths of a second, can provide a competitive advantage in high-speed, short-distance actions that frequently occur during matches. A 5.83% increase in VO₂ max suggests better aerobic fitness, which may help players maintain intensity throughout the game and recover more efficiently between efforts. Additionally, the 16 cm improvement in HJ distance reflected a significant gain in horizontal power and neuromuscular control, which are essential for sprinting, lateral movements, and quick stops or starts. Improved HJ performance is also linked to a reduced risk of injury, particularly for non-contact lower-limb injuries such as ACL tears, due to enhanced eccentric control and improved landing stability. Together, these functional outcomes indicate that the combined training intervention not only boosts performance but may also contribute to increased resilience and reduced injury risk in adolescent football players.
Conclusion
Six weeks of DHIRT combined with SSE, performed four times per week, led to significant improvements in several football-related performance variables, including vertical and HJs, RS, and VO₂ max, indicating enhanced athletic readiness in novice players. These findings support the use of a moderate-to-high intensity resistance training protocol (60–80% of 1RM) in combination with static stretching; however, further research is needed to determine the most effective intensity thresholds within this range.
From a practical standpoint, coaches working with adolescent football players should consider incorporating these combined protocols into their regular training schedules. A feasible implementation could involve two to four sessions per week, with resistance training performed at 60%–80% 1RM and 15–30 minutes of static stretching targeting major lower-limb muscle groups, scheduled either before or after resistance exercises based on logistical preference.
This study has some methodological limitations that offer valuable avenues for future investigations. Comparative trials examining diverse combinations of stretching and resistance training protocols are warranted to delineate their specific effects on athletic performance and the risk of injury. Although the current sample size was adequate for preliminary analysis, a larger and more heterogeneous cohort would improve the generalizability of the results. Additionally, the timing and duration of static stretching within combined interventions, such as pre-versus post-exercise application and variations in stretching length, should be systematically evaluated. Future research should also address potential selection bias inherent in digital recruitment, standardize control group activity levels, and employ more precise assessment tools (e.g. electronic sprint timing). Finally, although the proposed mechanisms, such as fast-twitch fiber recruitment and muscle-tendon elasticity, are theoretically grounded, they were not directly assessed due to logistical constraints. Incorporating neuromuscular and biomechanical measurements (e.g. electromyography, motion capture) is essential for validating the underlying physiological adaptations.
Ethical Considerations
Compliance with ethical guidelines
This study was approved by the Ethics Committee of University of Sciences and Arts in Lebanon, Beirut, Lebanon, and written informed consent was obtained from the participants and their guardians.
Funding
The paper was extracted from the BA thesis of Hussein Ziab, approverd by, University of Sciences and Arts in Lebanon, Beirut, Lebanon.
Authors' contributions
Conceptualization, supervision and data analysis: Hussein Ziab; Data collection: Hani Deeb and Hassan Deeb; Funding acquisition and resources: Rami Mazbouh Methodology, investigation, writing the original draft, review & editing: All authors.
Conflict of interest
The authors declared no conflict of interest.
Acknowledgments
We acknowledge all the coaches and personal trainers who participated in this study.
References
- Amiri-Khorasani M, Calleja-Gonzalez J, Mogharabi-Manzari M. Acute effect of different combined stretching methods on acceleration and speed in soccer players. Journal of Human Kinetics. 2016; 50:179-86. [DOI:10.1515/hukin-2015-0154] [PMID]
- NSCA-National Strength & Conditioning Association. Essentials of strength training and conditioning. Champaign: Human kinetics; 2021. [Link]
- Knudson DV. Warm-up and flexibility. In: Jeff Chandler T, Brown LE, editors. Conditioning for strength and human performance. London: Routledge; 2018. [Link]
- Hedrick A. Dynamic flexibility training. Strength & Conditioning Journal. 2000; 22(5):76. [Link]
- Millis DL, Levine D. 25 - Range-of-Motion and Stretching Exercises. In: Millis D, Levine D, editors. Canine Rehabilitation and Physical Therapy (Second Edition). Amsterdam: Elsevier Health Sciences; 2013. [DOI:10.1016/B978-1-4377-0309-2.00025-9]
- Cross KM, Worrell TW. Effects of a static stretching program on the incidence of lower extremity musculotendinous strains. Journal of Athletic Training. 1999; 34(1):11-4. [PMID]
- Akagi R, Takahashi H. Effect of a 5-week static stretching program on hardness of the gastrocnemius muscle. Scandinavian Journal of Medicine & Science in Sports. 2014; 24(6):950-7. [DOI:10.1111/sms.12111] [PMID]
- Bacurau RF, Monteiro GA, Ugrinowitsch C, Tricoli V, Cabral LF, Aoki MS. Acute effect of a ballistic and a static stretching exercise bout on flexibility and maximal strength. Journal of Strength and Conditioning Research. 2009; 23(1):304-8. [DOI:10.1519/JSC.0b013e3181874d55] [PMID]
- Bishop D. Warm Up II. Sports Medicine. 2003; 33:483-98. [DOI:10.2165/00007256-200333070-00002]
- Little T, Williams AG. Effects of differential stretching protocols during warm-ups on high-speed motor capacities in professional soccer players. Journal of Strength and Conditioning Research. 2006; 20(1):203-7. [DOI:10.1519/R-16944.1] [PMID]
- Beckett JR, Schneiker KT, Wallman KE, Dawson BT, Guelfi KJ. Effects of static stretching on repeated sprint and change of direction performance. Medicine and Science in Sports and Exercise. 2009; 41(2):444-50. [DOI:10.1249/MSS.0b013e3181867b95] [PMID]
- Knudson D, Bennett K, Corn RO, Leick D, Smith C. Acute effects of stretching are not evident in the kinematics of the vertical jump. The Journal of Strength & Conditioning Research. 2001; 15(1):98-101. [Link]
- Koch AJ, O'Bryant HS, Stone ME, Sanborn K, Proulx C, Hruby J, et al. Effect of warm-up on the standing broad jump in trained and untrained men and women. Journal of Strength and Conditioning Research. 2003; 17(4):710-4. [DOI:10.1519/1533-4287(2003)017<0710:eowots>2.0.co;2] [PMID]
- Zakas A. The effect of stretching duration on the lower-extremity flexibility of adolescent soccer players. Journal of Bodywork and Movement Therapies. 2005; 9(3):220-25. [DOI:10.1016/j.jbmt.2004.07.002]
- Costa PB, Graves BS, Whitehurst M, Jacobs PL. The acute effects of different durations of static stretching on dynamic balance performance. Journal of Strength and Conditioning Research. 2009; 23(1):141-7. [DOI:10.1519/JSC.0b013e31818eb052] [PMID]
- Alpkaya U, Koceja D. The effects of acute static stretching on reaction time and force. The Journal of Sports Medicine and Physical Fitness. 2007; 47(2):147-50. [PMID]
- Bradley PS, Olsen PD, Portas MD. The effect of static, ballistic, and proprioceptive neuromuscular facilitation stretching on vertical jump performance. Journal of Strength and Conditioning Research. 2007; 21(1):223-6. [DOI:10.1519/00124278-200702000-00040] [PMID]
- Cornwell A. Acute effects of muscle stretching on vertical jump performance.Journal of Human Movement Studies. 2001; 40:307-24. [Link]
- Fowles JR, Sale DG, MacDougall JD. Reduced strength after passive stretch of the human plantarflexors. Journal of Applied Physiology (Bethesda, Md. : 1985). 2000; 89(3):1179-88. [DOI:10.1152/jappl.2000.89.3.1179] [PMID]
- Young WB, Behm DG. Effects of running, static stretching and practice jumps on explosive force production and jumping performance. The Journal of Sports Medicine and Physical Fitness. 2003; 43(1):21-7. [PMID]
- Taylor KL, Sheppard JM, Lee H, Plummer N. Negative effect of static stretching restored when combined with a sport specific warm-up component. Journal of Science and Medicine in Sport. 2009; 12(6):657-61. [DOI:10.1016/j.jsams.2008.04.004] [PMID]
- Weerapong P, Hume PA, Kolt GS. Stretching: Mechanisms and benefits for sport performance and injury prevention. Physical Therapy Reviews. 2004; 9(4):189-206. [DOI:10.1179/108331904225007078]
- Stone M, Ramsey MW, Kinser AM, O'Bryant HS, Ayers C, Sands WA. Stretching: Acute and chronic? The potential consequences. Strength & Conditioning Journal. 2006; 28(6):66-74. [Link]
- Smith LL, Brunetz MH, Chenier TC, McCammon MR, Houmard JA, Franklin ME, et al. The effects of static and ballistic stretching on delayed onset muscle soreness and creatine kinase. Research Quarterly for Exercise and Sport. 1993; 64(1):103-7. [DOI:10.1080/02701367.1993.10608784] [PMID]
- Silva JR, Nassis GP, Rebelo A. Strength training in soccer with a specific focus on highly trained players. Sports Medicine - Open. 2015; 1(1):17. [DOI:10.1186/s40798-015-0006-z] [PMID]
- Pacholek M, Zemková E. Effect of two strength training models on muscle power and strength in elite women's football players. Sports (Basel). 2020; 8(4):42. [DOI:10.3390/sports8040042] [PMID]
- Lora M de H. Strength training for performance optimization and injury prevention in professional football. Archivos de Medicina del Deporte. 2016; 33(6):364-5. [Link]
- Marques MC, Gil H, Ramos RJ, Costa AM, Marinho DA. Relationships between vertical jump strength metrics and 5 meters sprint time. Journal of Human Kinetics. 2011; 29:115-22. [DOI:10.2478/v10078-011-0045-6] [PMID]
- Ranisavljev I, Matić M, Janković N. The relationship between maximal strength, vertical jump, acceleration and change of direction performance. Facta Universitatis, Series: Physical Education and Sport. 2020; 17(3):591-9. [Link]
- Folland JP, Williams AG. The adaptations to strength training: Morphological and neurological contributions to increased strength. Sports Medicine (Auckland, N.Z.). 2007; 37(2):145-68. [DOI:10.2165/00007256-200737020-00004] [PMID]
- Izquierdo M, Ibañez J, González-Badillo JJ, Häkkinen K, Ratamess NA, Kraemer WJ, et al. Differential effects of strength training leading to failure versus not to failure on hormonal responses, strength, and muscle power gains. Journal of Applied Physiology . 2006; 100(5):1647-56. [DOI:10.1152/japplphysiol.01400.2005] [PMID]
- Garber CE, Blissmer B, Deschenes MR, Franklin BA, Lamonte MJ, Lee IM, et al. Quantity and quality of exercise for developing and maintaining cardiorespiratory, musculoskeletal, and neuromotor fitness in apparently healthy adults guidance for prescribing exercise. Medicine & Science in Sports & Exercise. 2011; 43(7):1334-59. [Link]
- Suchomel TJ, Nimphius S, Bellon CR, Hornsby WG, Stone MH. Training for muscular strength: methods for monitoring and adjusting training intensity. Sports Medicine. 2021; 51(10):2051-66. [DOI:10.1007/s40279-021-01488-9] [PMID]
- Faigenbaum AD, Kraemer WJ, Blimkie CJ, Jeffreys I, Micheli LJ, Nitka M, et al. Youth resistance training: Updated position statement paper from the national strength and conditioning association. Journal of Strength and Conditioning Research. 2009; 23(5 Suppl):S60-79. [DOI:10.1519/JSC.0b013e31819df407] [PMID]
- Topolovec-Vranic J, Natarajan K. The use of social media in recruitment for medical research studies: A scoping review. Journal of Medical Internet Research. 2016; 18(11):e286. [DOI:10.2196/jmir.5698] [PMID]
- Rodríguez-Lorenzo L, Fernandez-del-Olmo M, Martín-Acero R. A critical review of the technique parameters and sample features of maximal kicking velocity in soccer. Strength & Conditioning Journal. 2015; 37(5):26-39. [DOI:10.1519/SSC.0000000000000172]
- Russell M, Benton D, Kingsley M. Reliability and construct validity of soccer skills tests that measure passing, shooting, and dribbling. Journal of Sports Sciences. 2010; 28(13):1399-408. [DOI:10.1080/02640414.2010.511247] [PMID]
- Halliday D, Resnick R, Walker J. Fundamentals of physics, extended, 12th edition. Hoboken: Wiley; 2021. [Link]
- Murray L, Beaven CM, Hébert-Losier K. Reliability of overground running measures from 2d video analyses in a field environment. Sports (Basel). 2018; 7(1):8. [DOI:10.3390/sports7010008] [PMID]
- Elsaidy WS. The validity and reliability of the 20-m multistage shuttle run test to predict vo2max in egyptian football players. Paper presented at: Hawaii International Conference on Education; 2012 January 8; Honolulu, Hawaii. [Link]
- Léger LA, Lambert J. A maximal multistage 20-m shuttle run test to predict VO2 max. European Journal of Applied Physiology and Occupational Physiology. 1982; 49(1)1-12. [DOI:10.1007/BF00428958] [PMID]
- Lumb AB. Appendix A - Physical Quantities and Units of Measurement. In: Lumb AB, Thomas CR, editors. Nunn’s Applied Respiratory Physiology. Amsterdam: Elsevier; 2020. [Link]
- Murphy AJ, Lockie RG, Coutts AJ. Kinematic determinants of early acceleration in field sport athletes. Journal of Sports Science & Medicine. 2003; 2(4):144-50. [PMID]
- Haugen T, Buchheit M. Sprint running performance monitoring: Methodological and practical considerations. Sports Medicine. 2016; 46(5):641-56. [DOI:10.1007/s40279-015-0446-0] [PMID]
- Klavora P. Vertical-jump Tests: A critical review. Strength & Conditioning Journal. 2000; 22(5):70. [Link]
- Matúš I, Ružbarský P, Vadašová B, Czarny W. Horizontal and vertical jumping abilities and kick start performance in competitive swimmers. Journal of Physical Education and Sport. 2022; 22(1):273-80. [Link]
- Maulder P, Cronin J. Horizontal and vertical jump assessment: Reliability, symmetry, discriminative and predictive ability. Physical therapy in Sport. 2005; 6(2):74-82. [Link]
- Froelicher VF, Myers J. Basic exercise physiology. In: Froelicher VF, Myers J, editors. Exercise and the heart. Philadelphia: W.B. Saunders; 2008. [Link]
- Bandyopadhyay A. Validity of Cooper’s 12-minute run test for estimation of maximum oxygen uptake in male university students. Biology of Sport. 2015; 32(1):59-63. [DOI:10.5604/20831862.1127283] [PMID]
- Cooper KH. A means of assessing maximal oxygen intake. Correlation between field and treadmill testing. JAMA. 1968; 203(3):201-4. [PMID]
- Rosenblat MA, Granata C, Thomas SG. Effect of interval training on the factors influencing maximal oxygen consumption: A systematic review and meta-analysis. Sports Medicine. 2022; ;52(6):1329-52. [DOI:10.1007/s40279-021-01624-5] [PMID]
- Brzycki M. Strength Testing-Predicting a One-Rep Max from Reps-to-Fatigue. Journal of Physical Education, Recreation & Dance. 1993; 64(1):88-90. [DOI:10.1080/07303084.1993.10606684]
- Haskell WL, Lee IM, Pate RR, Powell KE, Blair SN, Franklin BA, et al. Physical activity and public health: updated recommendation for adults from the American College of Sports Medicine and the American Heart Association. Medicine and science in sports and exercise. 2007; 39(8):1423-34. [DOI:10.1249/mss.0b013e3180616b27] [PMID]
- Ylinen J. Stretching therapy: For sport and manual therapies. London: Churchill Livingstone Elsevier; 2008. [Link]
- Shrout PE, Fleiss JL. Intraclass correlations: Uses in assessing rater reliability. Psychological Bulletin. 1979; 86(2):420-8. [DOI:10.1037/0033-2909.86.2.420] [PMID]
- Lakens D. Calculating and reporting effect sizes to facilitate cumulative science: A practical primer for t-tests and ANOVAs. Frontiers in Psychology. 2013; 4:863. [DOI:10.3389/fpsyg.2013.00863] [PMID]
- Smith AM, Scott SG, Wiese DM. The psychological effects of sports injuries coping. Sports Medicine. 1990; 9(6):352-69. [DOI:10.2165/00007256-199009060-00004] [PMID]
- Brooks SV, Faulkner JA. Forces and powers of slow and fast skeletal muscles in mice during repeated contractions. The Journal of Physiology. 1991; 436:701-10. [PMID]
- Mikolajec K, Waskiewicz Z, Maszczyk A, Bacik B, Kurek P, Zajc A. Effects of stretching and strength exercises on speed and power abilities in male basketball players. Isokinetics and Exercise Science. 2012; 20(1):61-9. [DOI:10.3233/IES-2012-0442]
- Yamaguchi T, Ishii K. Effects of static stretching for 30 seconds and dynamic stretching on leg extension power. Journal of Strength and Conditioning Research. 2005; 19(3):677-83. [DOI:10.1519/15044.1] [PMID]
- Yamaguchi T, Ishii K, Yamanaka M, Yasuda K. Acute effects of dynamic stretching exercise on power output during concentric dynamic constant external resistance leg extension. Journal of Strength and Conditioning Research. 2007; 21(4):1238-44. [DOI:10.1519/R-21366.1] [PMID]
- Dasteridis G, Piliandis T, Mantzouranis N. The effect of different strength training programs on young athletes’ sprint performance. Studies in Physical Culture and Tourism. 2011; 18(2):141-7. [Link]
- Beattie K, Kenny IC, Lyons M, Carson BP. The effect of strength training on performance in endurance athletes. Sports Medicine. 2014; 44(6):845-65. [DOI:10.1007/s40279-014-0157-y] [PMID]
- Alikhajeh Y, Rahimi NM, Fazeli H, Rahimi RM. Differential stretching protocols during warm up on select performance measures for elite male soccer players. Procedia-Social and Behavioral Sciences. 2012; 46:1639-43. [Link]
- Christensen BK, Nordstrom BJ. The effects of proprioceptive neuromuscular facilitation and dynamic stretching techniques on vertical jump performance. Journal of Strength and Conditioning Research. 2008; 22(6):1826-31. [DOI:10.1519/JSC.0b013e31817ae316] [PMID]
- Samuel MN, Holcomb WR, Guadagnoli MA, Rubley MD, Wallmann H. Acute effects of static and ballistic stretching on measures of strength and power. Journal of Strength and Conditioning Research. 2008; 22(5):1422-8. [DOI:10.1519/JSC.0b013e318181a314] [PMID]
- Tsolakis C, Douvis A, Tsigganos G, Zacharogiannis E, Smirniotou A. Acute effects of stretching on flexibility, power and sport specific performance in fencers. Journal of Human Kinetics. 2010; 26(1):105-14. [Link]
- Hough PA, Ross EZ, Howatson G. Effects of dynamic and static stretching on vertical jump performance and electromyographic activity. Journal of Strength and Conditioning Research. 2009; 23(2):507-12. [DOI:10.1519/JSC.0b013e31818cc65d] [PMID]
- Gelen E, Saygın Ö, Karacabey K, Kilinc F. Acute effects of static stretching on vertical jump performance in children. Journal of Human Sciences. 2008; 5(1):1-10. [Link]
- Anthrakidis N, Skoufas D, Lazaridis S, Zaggelidis G. Relationship between muscular strength and kicking performance. Physical Training. 2008; 10(2):1-8. [Link]
- Workman CD. Effects of static stretching on foot velocity during the instep soccer kick [MA thesis]. Utah: Utah State University; 2010. [Link]
- Kingsley JD, Figueroa A. Acute and training effects of resistance exercise on heart rate variability. Clinical Physiology and Functional Imaging. 2016; 36(3):179-87. [DOI:10.1111/cpf.12223] [PMID]
- Meka N, Katragadda S, Cherian B, Arora RR. Endurance exercise and resistance training in cardiovascular disease. Therapeutic Advances in Cardiovascular Disease. 2008; 2(2):115-21.[DOI:10.1177/1753944708089701] [PMID]
- Mojock CD, Kim JS, Eccles DW, Panton LB. The effects of static stretching on running economy and endurance performance in female distance runners during treadmill running. Journal of Strength and Conditioning Research. 2011; 25(8):2170-6. [DOI:10.1519/JSC.0b013e3181e859db] [PMID]
- Hepple RT, Mackinnon SL, Thomas SG, Goodman JM, Plyley MJ. Quantitating the capillary supply and the response to resistance training in older men. Pflugers Archiv : European Journal of Physiology. 1997; 433(3):238-44. [DOI:10.1007/s004240050273] [PMID]
- Coggan AR, Spina RJ, King DS, Rogers MA, Brown M, Nemeth PM, et al. Skeletal muscle adaptations to endurance training in 60- to 70-yr-old men and women. Journal of Applied Physiology. 1992; 72(5):1780-6. [DOI:10.1152/jappl.1992.72.5.1780] [PMID]
- Bean A. The complete guide to strength training 5th edition. London: Bloomsbury Publishing; 2015. [Link]
Type of Study: Research |
Subject:
General
Received: 2025/03/18 | Accepted: 2025/05/31 | Published: 2025/10/18
Received: 2025/03/18 | Accepted: 2025/05/31 | Published: 2025/10/18
Send email to the article author
| Rights and permissions | |
 |
This work is licensed under a Creative Commons Attribution-NonCommercial 4.0 International License. |
This is an open access article distributed under the terms of the Creative Commons Attribution-NonCommercial 4.0 (CC-By-NC 4.0), which permits use, distribution, and reproduction in any medium, provided the original work is properly cited and is not used for commercial purposes.
Contact Information