Thu, Jul 30, 2026
Volume 15, Issue 4 (Autumn 2025)
PTJ 2025, 15(4): 289-306 |
Back to browse issues page


Download citation:
BibTeX | RIS | EndNote | Medlars | ProCite | Reference Manager | RefWorks
Send citation to:


BibTeX | RIS | EndNote | Medlars | ProCite | Reference Manager | RefWorks
Send citation to:
Abbaslou H, Alboghobeish A, Seyed Qureshi S, Alaei Z, Safari M, Izadi N et al . Impact of Digital Device Use on Vision Syndrome and Sleep Quality Among Iranian University Staffy. PTJ 2025; 15 (4) :289-306
URL: http://ptj.uswr.ac.ir/article-1-664-en.html
URL: http://ptj.uswr.ac.ir/article-1-664-en.html
Hossein Abbaslou1 

 , Ali Alboghobeish2 , Shirini Seyed Qureshi2 , Zahra Alaei1 , Mehdi Safari3 , Neda Izadi4 , Ali Salehi Sahlabadi *5
, Ali Alboghobeish2 , Shirini Seyed Qureshi2 , Zahra Alaei1 , Mehdi Safari3 , Neda Izadi4 , Ali Salehi Sahlabadi *5
1- Department of Occupational Health Engineering, School of Public Health, Tehran University of Medical Sciences, Tehran, Iran.
2- Department of Occupational Health and Safety Engineering, School of Public Health and Safety, Shahid Beheshti University of Medical Sciences, Tehran, Iran.
3- Department of Disasters and Emergencies, School of Public Health and Safety Shahid Beheshti University of Medical Sciences, Tehran, Iran.
4- Social Determinants of Health Research Center, Endocrine Sciences Institute, Shahid Beheshti University of Medical Sciences, Tehran, Iran.
5- Department of Occupational Health and Safety Engineering, School of Public Health and Safety, Shahid Beheshti University of Medical Sciences, Tehran, Iran. & Safety Promotion and Injury Prevention Research Center, Research Institute for Health Sciences and Environment, Shahid Beheshti University of Medical Sciences, Tehran, Iran.
Keywords: Vision disorder, Sleep quality, Risk factor, Employees, Universities, Video display terminals
Full-Text [PDF 755 kb]
(1244 Downloads)
| Abstract (HTML) (2138 Views)
Full-Text: (643 Views)
Introduction
In recent decades, significant technological progress has transformed the use of computers and video terminals into an integral part of our personal lives [1, 2]. Today, almost every institution, department, and organization uses computers for various activities, such as typing, design, computing, and communication [3]. Although these devices offer numerous benefits in terms of communication, productivity, and entertainment, concerns have been raised about their potential negative effects on health and well-being [4, 5]. During the COVID-19 pandemic, reliance on digital devices surged for people in both work and educational settings [6-8].
Computer vision syndrome (CVS) is a collection of visual problems associated with activities related to or performed while using computers [9, 10]. The most common symptoms include eye irritation, fatigue, redness, stimulation, tearing, blurred vision, color vision disturbances, headache, and light sensitivity [11, 12]. Approximately 60 million computer users worldwide suffer from CVS, with nearly one million new cases added annually [11]. Many studies have shown a high prevalence of CVS (60-90%) among users of digital displays [13-16]. It also affects the quality of life, including sleep quality (SQ) and stress, and consequently reduces productivity [11]. Adequate sleep duration and quality are crucial components of an individual’s physical and emotional health [17].
Today, the impact of long-term digital device use on sleep has become a concern, causing a significant decrease in the quantity and quality of sleep [11, 18]. This issue is especially relevant in the workplace, where prolonged screen time can lead to sleep disturbances and decreased productivity. Poor sleep affects cognitive functions, such as attention, memory, and decision-making, leading to decreased focus and slower task completion. It also contributes to mood disturbances, fatigue, and increased errors, all of which reduce workplace productivity.
A study conducted in Croatia during the lockdown investigated the use of digital technology (DT), SQ, and the relationships between these factors in children and their parents [19]. The findings revealed differing impacts of DT use on SQ between the two groups. For parents, no significant relationship was found between DT use and SQ. In contrast, prolonged smartphone use for leisure among children was negatively associated with SQ.
A retrospective cohort study explored the relationship between the incidence of sleep problems and changes in digital media usage among university students in Japan during the COVID-19 pandemic [20]. Students who reported an increase in digital media use between 2019 and 2020 were found to have a higher risk (odds ratio [OR]: 1.76; 95% confidence interval [CI], 1.21%, 2.55%) of experiencing sleep problems in 2020.
Difficulty falling asleep, recurrent nighttime, sleep disturbances, and snoring are reported in the wake of sleep problems [21]. Prolonged exposure to light emitted by electronic devices, such as computer screens and cell phones, causes changes in nocturnal sleep patterns and suppresses melatonin levels, which in turn affect SQ [22, 23].
Several studies have found that a significant portion of the general population spends at least nine hours per day engaging with digital devices [24-26]. This extensive usage has been linked to addictive behaviors. One study demonstrated that individuals with excessive smartphone usage exhibited notable deficits in the early stages of inhibition processing [27]. Consequently, examining the impact of computer usage among office workers, who typically have prolonged exposure to digital devices, is of paramount importance.
Some previous research on the ocular effects of digital device use primarily focused on users who utilized cathode ray tube (CRT) displays [28]. In contrast, contemporary professional computer users predominantly employ laptops or other flat LCD or LED screens, which may differ from CRTs in terms of visual ergonomics and potentially influence the development of ocular symptoms. Therefore, new studies are required to investigate the impact of using these advanced monitoring devices.
These studies have predominantly been conducted among university students, with one study utilizing a web-based survey, thus limiting respondents to social media and Internet users [1, 2, 29-31]. Consequently, the findings may not be representative of other population groups, such as office workers, due to factors, such as differences in monitor usage and varying work hours.
While previous research has primarily focused on the ocular effects of digital device use in the general population or among university students, few studies have explored the impact of prolonged screen time on office workers. Given that office workers often experience extended exposure to digital devices, this demographic requires further investigation. Additionally, most studies have focused on traditional CRT displays; however, modern devices, such as laptops and LCD/LED screens, may present different ergonomic challenges.
Additionally, the high prevalence of CVS symptoms reported in previous studies (97.9%, 77.5%, 81%, and 48.7%) underscores the necessity of investigating these symptoms among other demographic groups [29-32].
Furthermore, the associated factors of CVS are scarce and inconsistent. For example, Canto-Sancho et al. identified headache and itching as the most frequent symptoms, whereas other studies reported blurred vision, eye pain, and redness as predominant issues [1, 2, 31].
To the best of our knowledge, no study has examined the relationship between the prevalence of CVS and the SQ with the use of digital devices in Iran. This study aims to provide baseline data that can assist public health professionals in developing effective strategies to address this emerging public health concern.
This study aimed to examine the hypothesis that increased use of electronic devices among administrative staff at a university center is associated with a higher prevalence of CVS and poorer SQ. The results of this study can provide essential health information for administrative staff working with video terminals daily. By examining the prevalence of CVS and its relationship with SQ among administrative staff at a university, this study can inform health policies and provide insights into improving workplace productivity by addressing the impact of digital device use on SQ.
Materials and Methods
This cross-sectional study was conducted among administrative staff in Tehran City, Iran, in 2023. The study population consisted of all employees in the office sector with a minimum of one year’s work experience and no history of musculoskeletal disorders. Musculoskeletal disorders, particularly those affecting the neck, back, or shoulders, can affect posture and ergonomics, which may exacerbate CVS symptoms or disrupt sleep. By excluding these individuals, we aimed to control for potential confounding factors. The sample size was calculated based on the prevalence of CVS reported in previous studies (approximately 49%) with a 5% margin of error as mentioned in Equation 1.

Where, “Z” is the Z-score corresponding to the desired confidence level (e.g. 1.96 for 95% confidence). “p” is the estimated prevalence or proportion (e.g. 0.5 if unknown). “e” is the margin of error (e.g. 0.05 for ±5%). “N” is the total population size.
Considering the specific statistical volume for population size of 1500 people, approximately 300 individuals were eligible for inclusion in the study. Due to difficulties in coordination and accessibility, only staff working at the university’s headquarters were included. Simple random sampling was applied by directly selecting participants from the headquarters population, ensuring equal chances of selection without relying on pre-made lists or identification numbers [33]. After determining the number of samples, a simple random sampling method was used to select the study participants.
Data collection
In this study, the conditions of university employees were first examined to select the sample according to the sample size and criteria for participation in the study. Written consent was obtained from the employees to obtain the required information. In this study, information on CVS and SQ was collected using a questionnaire. In addition, information about individuals’ characteristics (age, history, working hours, gender and education) was collected. The Persian version of the Pittsburgh SQ index (PSQI) questionnaire was used to assess SQ [34]. The translation involved independent translations by two fluent English-speaking native Iranians, followed by reconciliation and back-translation into English by a bilingual native speaker. The final version was pilot-tested on 12 subjects and approved by an expert panel for conceptual and linguistic equivalence. Cronbach’s α coefficient was 0.77. The corrected item–total correlations ranged from 0.30 to 0.75 for the seven PSQI component scores. The sensitivity and specificity were 94% and 72% for a PSQI cutoff value of 5 and 85% and 84% for a PSQI cutoff value of 6. The questionnaire consists of seven components, each scored from 0 to 3. The components include a general description of SQ, sleep latency, adequacy of sleep, sleep disturbance, and morning performance. Finally, the scores of each component were aggregated and converted into a total score (0-21). Higher scores in each component or the overall score indicate poor SQ. Scores of 0, 1, 2, and 3 on each scale represent normal situations and the presence of mild, moderate, and severe problems, respectively. A total score >6 indicates inadequate SQ. The Persian version of the CVS standard questionnaire was used to investigate CVS [35]. Similar to the PSQI, the CVS questionnaire was translated and adapted to the Persian context through a detailed process. First, two bilingual translators independently translated the English version into Persian. After reconciling the two translations, the version was back-translated into English by two bilingual translators to ensure the accuracy and consistency of the translation. A panel of experts reviewed the back-translations and compared them with the original version to ensure that the meaning was preserved and the terminology was culturally appropriate. As recommended by the ISPOR translation and cultural adaptation (TCA) guidelines, cultural adaptations were made to ensure that the terminology reflected local practices and was contextually relevant to Persian-speaking individuals. This questionnaire demonstrated a strong sensitivity of 81.1% and satisfactory specificity of 69.2%. Additionally, it exhibited good internal consistency with a Cronbach’s α of 0.80 and reliable test–retest consistency, reflected by an intraclass correlation coefficient (ICC) of 0.81 and a κ of 0.65.
The questionnaire covers the frequency and intensity of 16 visual signals associated with visual disturbances. The total score for each indicator was determined by summing the frequency and intensity, and the final score was then calculated. If this score is above 6, it means that the person suffers from CVS.
Data analysis
Data were analyzed using SPSS software, version 26, and descriptive statistics were used for all variables. The Mean±SD, median, and interquartile range (IQR) were used for continuous variables, and percentage for qualitative variables. Prior to conducting statistical tests, the data were assessed for normality using the Kolmogorov–Smirnov test. Based on the results of the normality tests, appropriate statistical tests were selected. Chi-square, Mann-Whitney, and t-tests were used to examine the relationship between the occurrence of CVS and risk factors about variable type. The mean significance level for all tests was 5%. A similar trend was observed when evaluating potential factors affecting SQ.
A regression analysis was conducted to assess the relationship between CVS and SQ, including variables, such as monitor use at work and outside of work, and taking breaks. Initially, variables were included in a binary logistic regression model, and those with P<0.2 were advanced to a multivariable logistic regression model. This approach aimed to evaluate the association between monitor use, taking breaks, and CVS and SQ. The results were presented as ORs with 95% CI.
The results of the logistic regression analysis were used to examine the relationship between CVS and SQ, with variables, including monitor use at work and outside of work, and taking breaks, adjusted for variables, including age, gender, marital status, education level, smoking, use of contact lenses, glasses, and eye drops, monitor cleaning, eye surgery, eye diseases, and work experience.
Results
Demographic and occupational characteristics
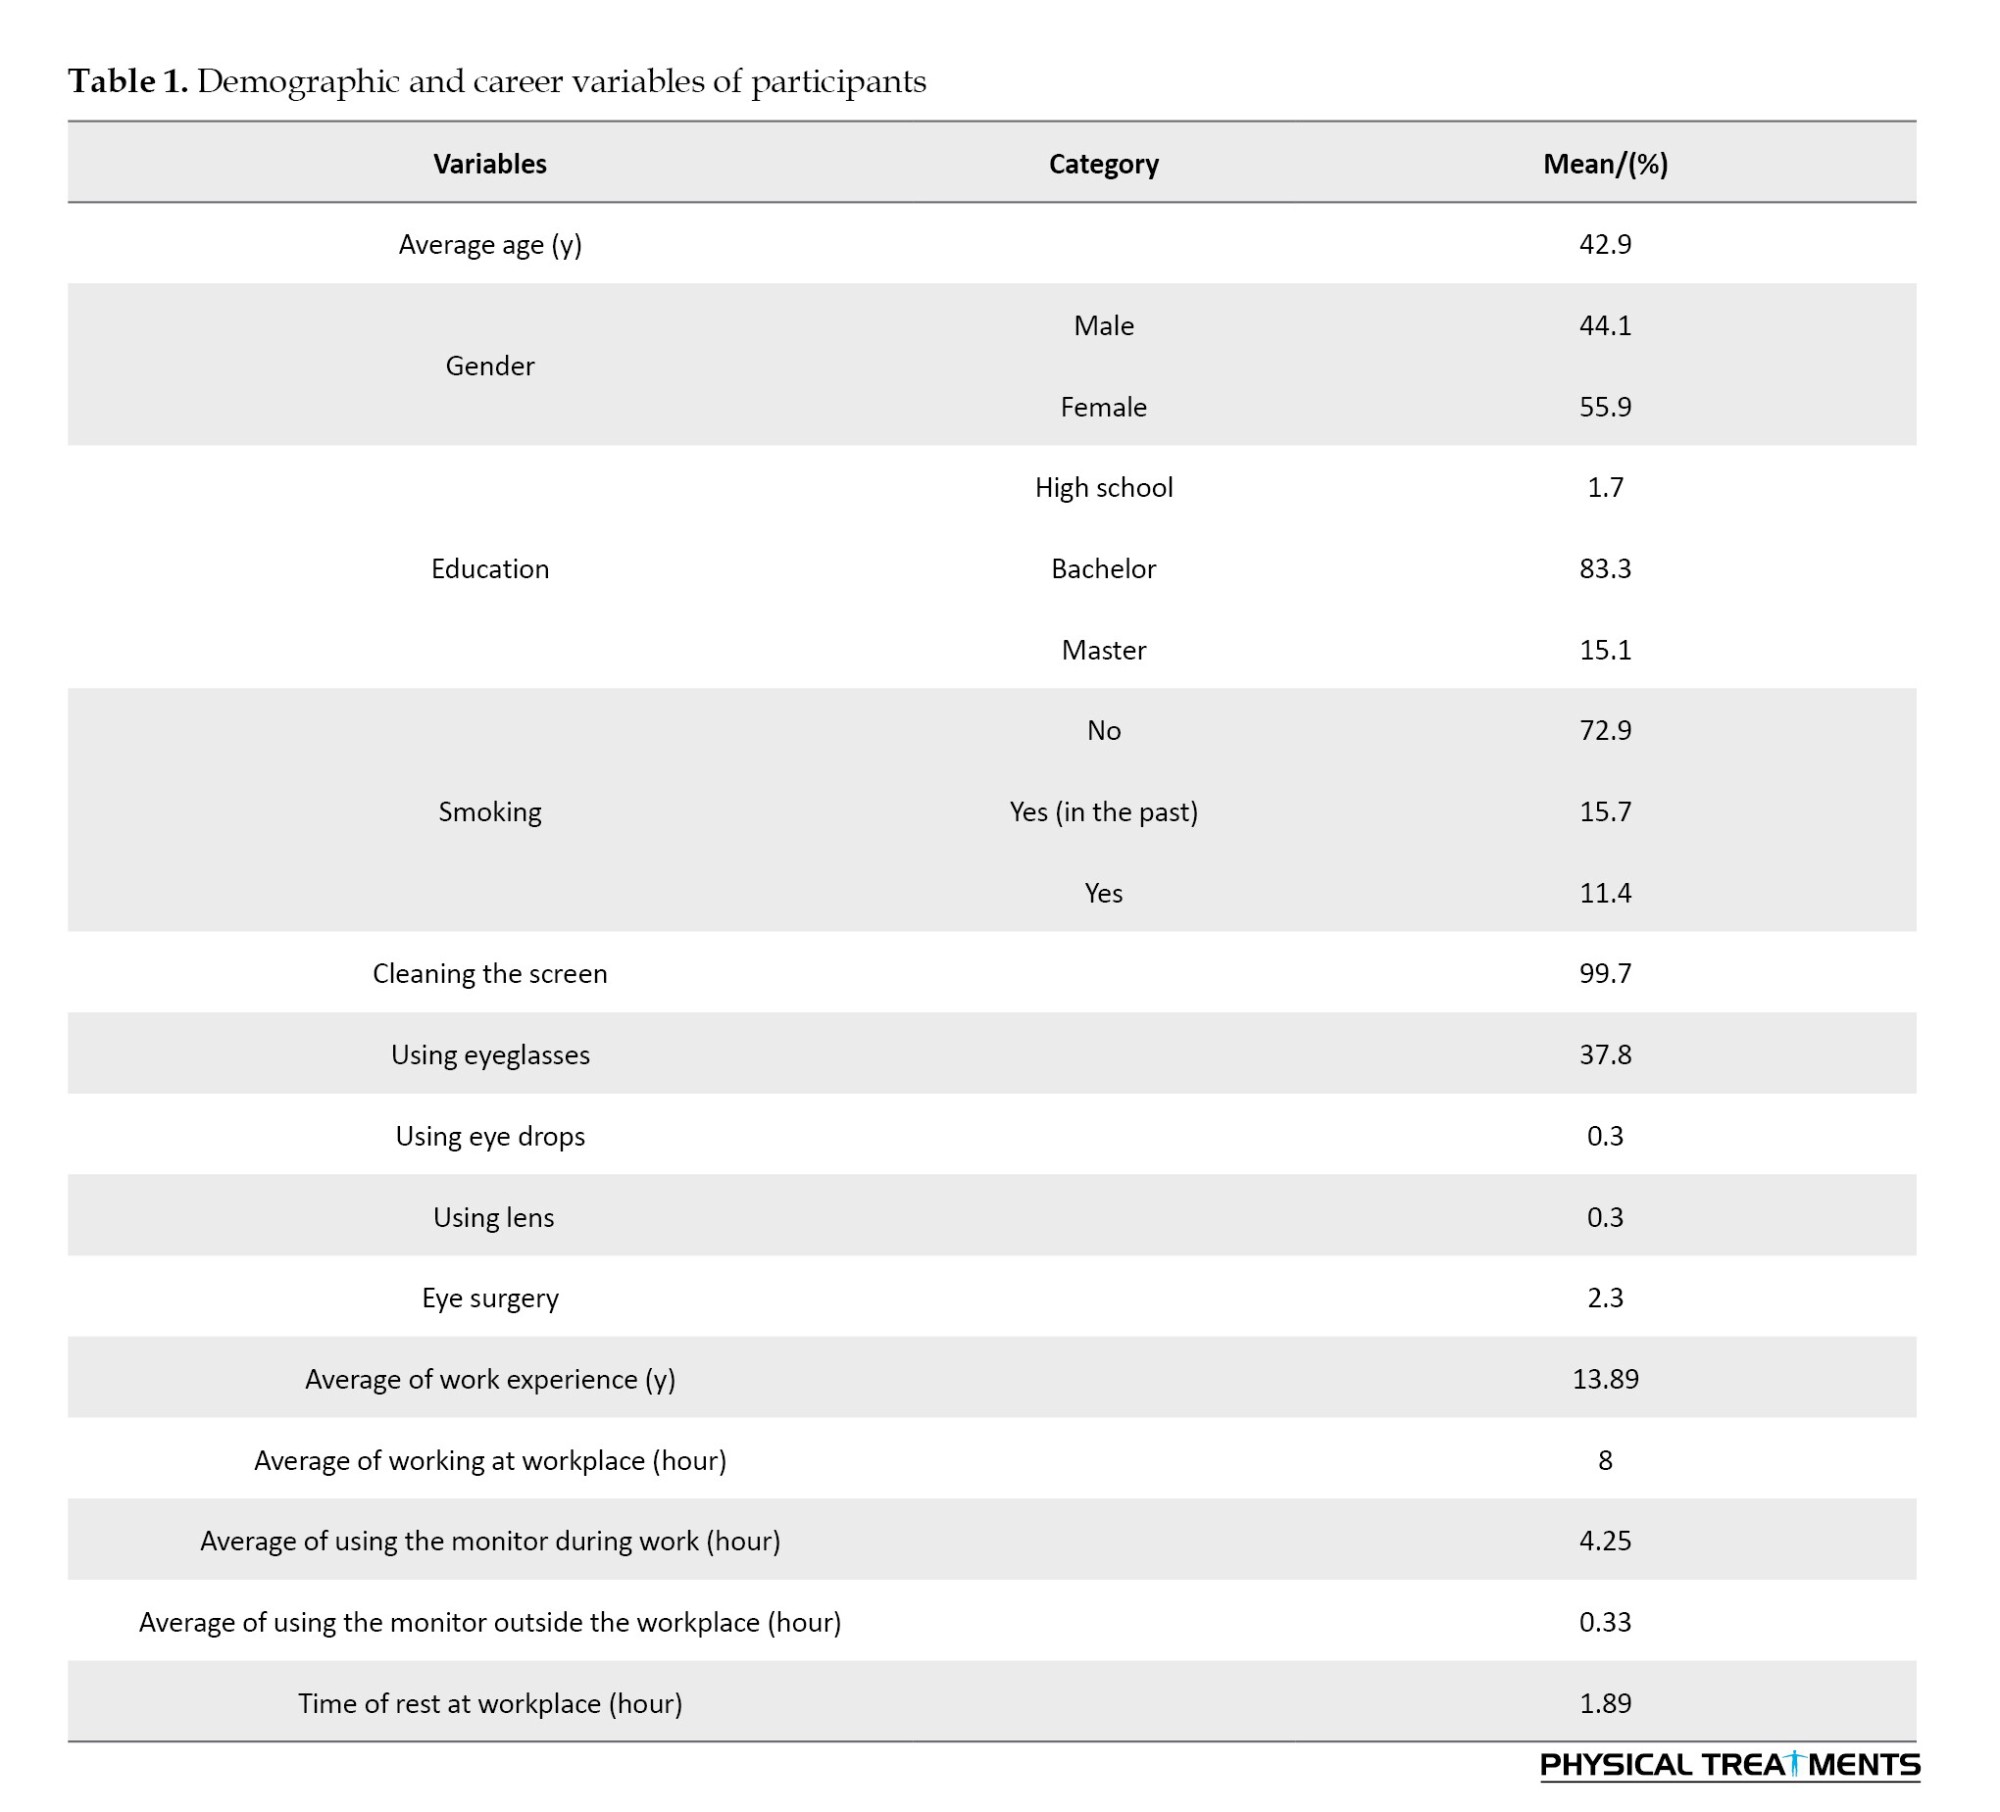
A total of 299 questionnaires were collected from administrative staff at a specific university center in Iran. The mean age of participants was 42.9 years (range: 29-59) with a gender distribution of 44.1% male and 55.9% female. Among the participants, 27.1% reported a history of smoking. Additionally, regular screen cleaning (99.7%) was the most frequently reported visual intervention. Participants spent an average of 4.25 hours per day using a monitor at work, with 2-6 hours dedicated to this activity. Outside of work hours, individuals used a monitor for an average of 0.33 hours, and allocated 1.89 hours for breaks during work (Table 1).
Prevalence of CVS
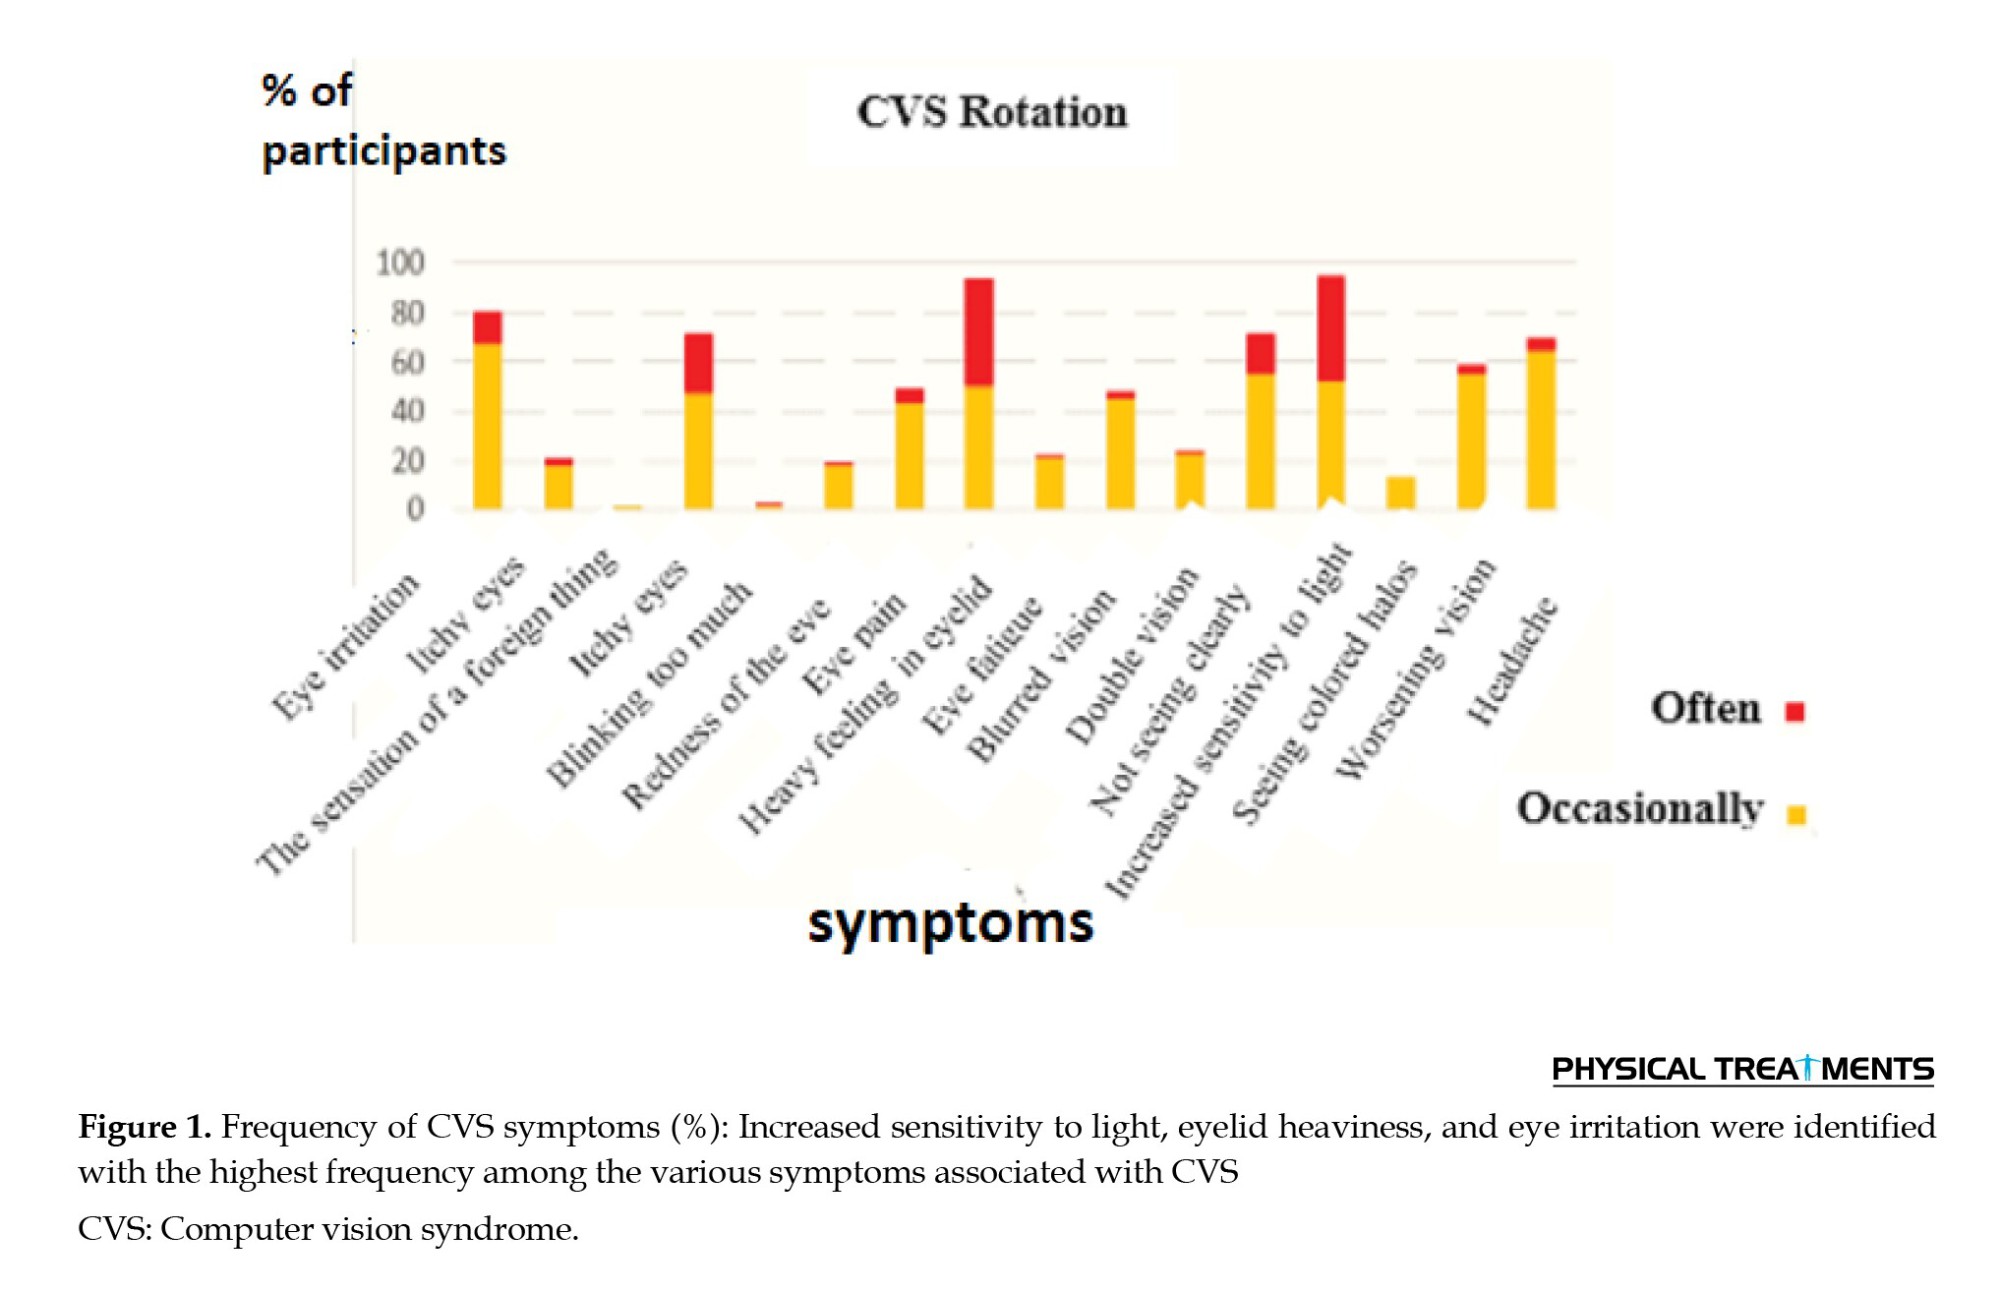
This study found that approximately 28.1% of the participants exhibited symptoms indicative of CVS. The mean CVS score of the participants was 7.78, ranging from 0 to 20. All participants in the study manifested at least one symptomatic feature. As depicted in Figure 1, heightened light sensitivity, eyelid heaviness, and eye irritation were identified with the highest frequency among the various symptoms associated with CVS.
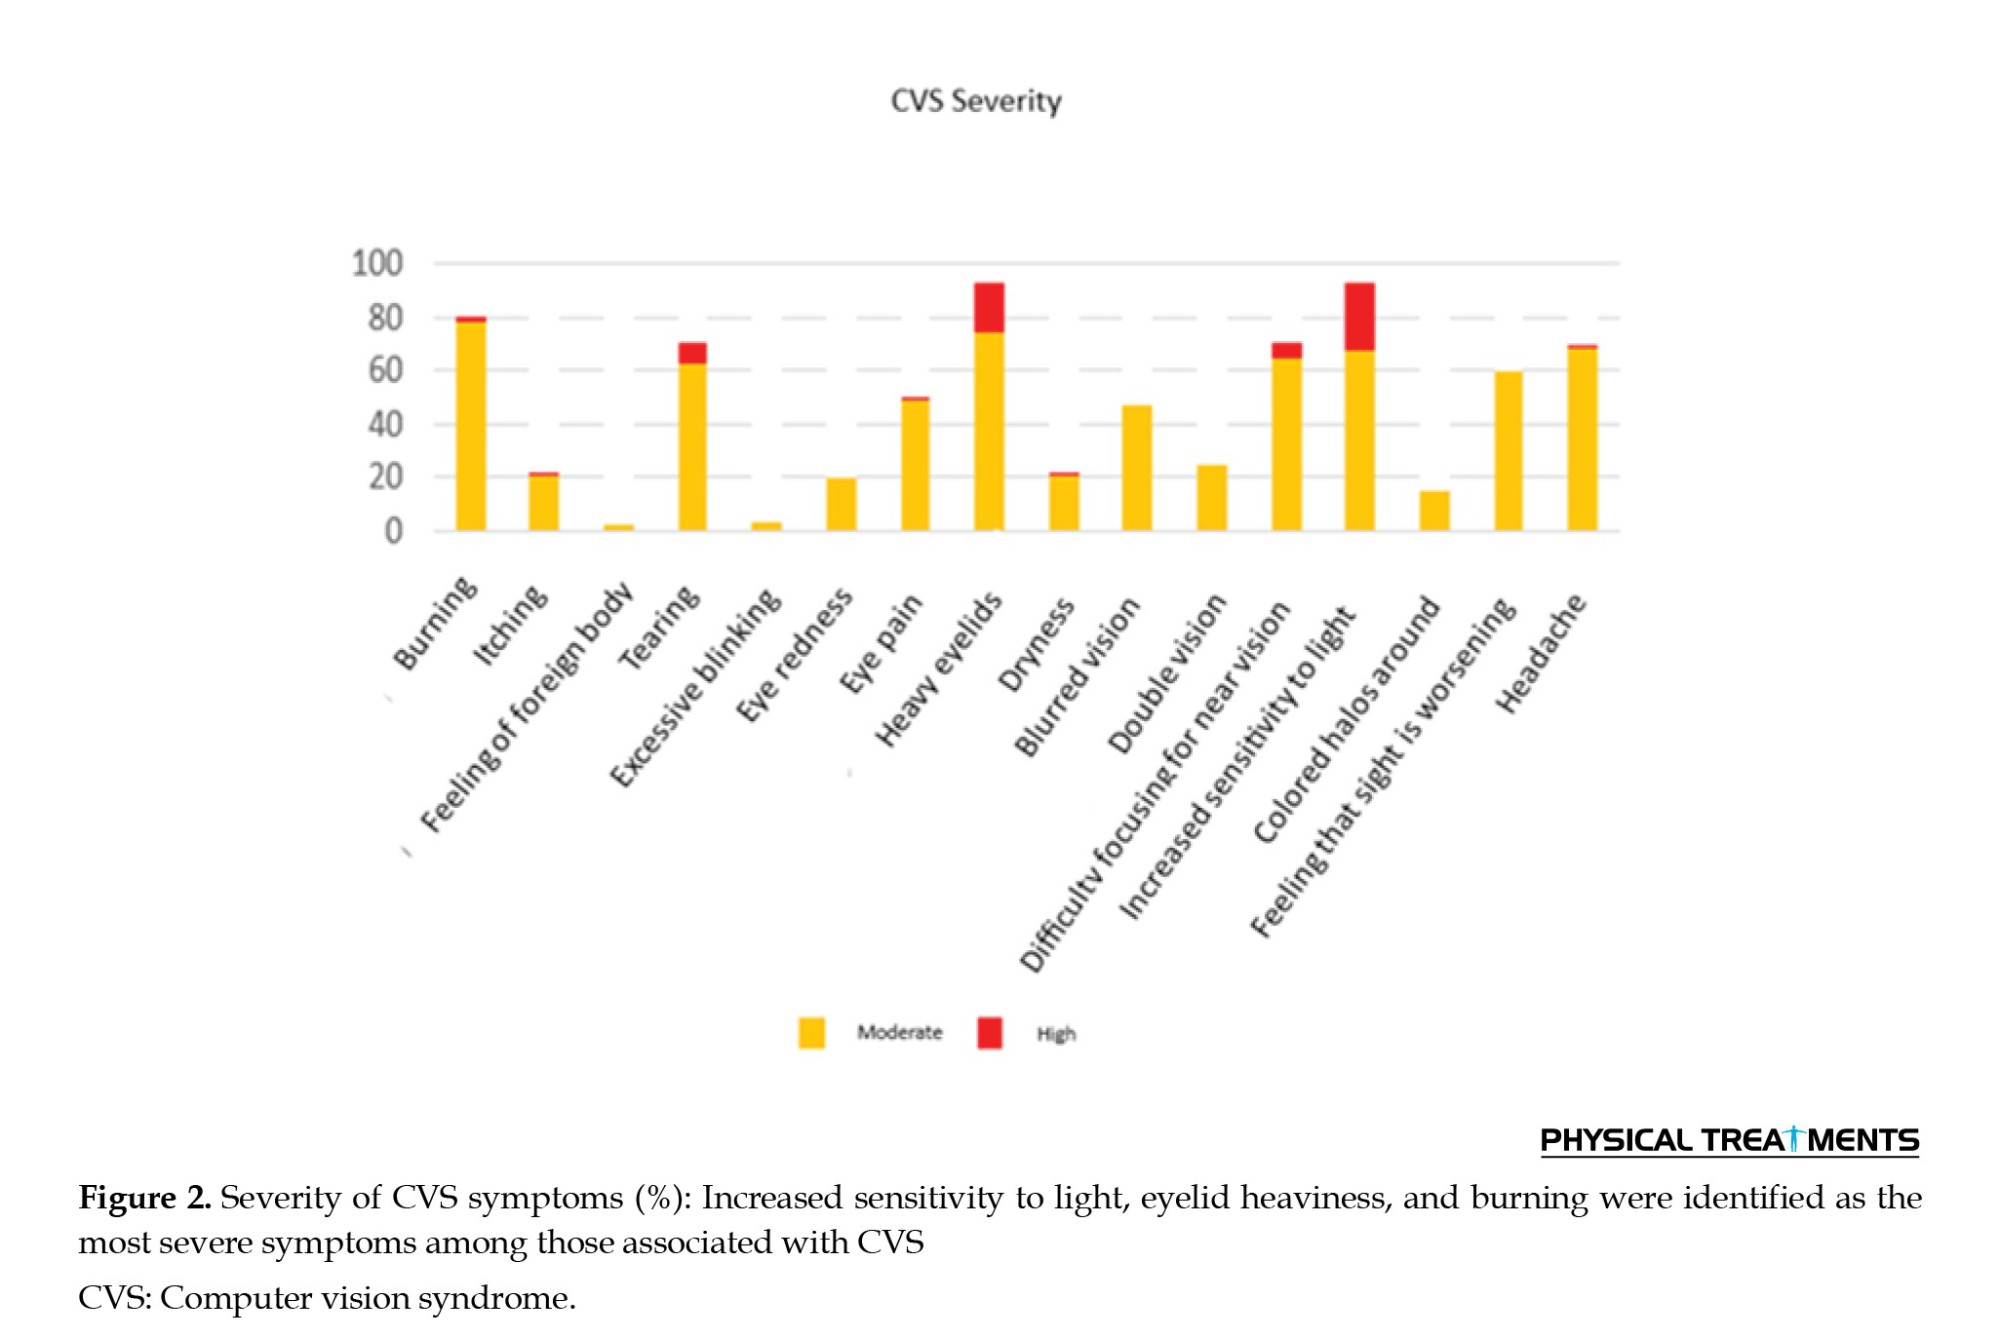
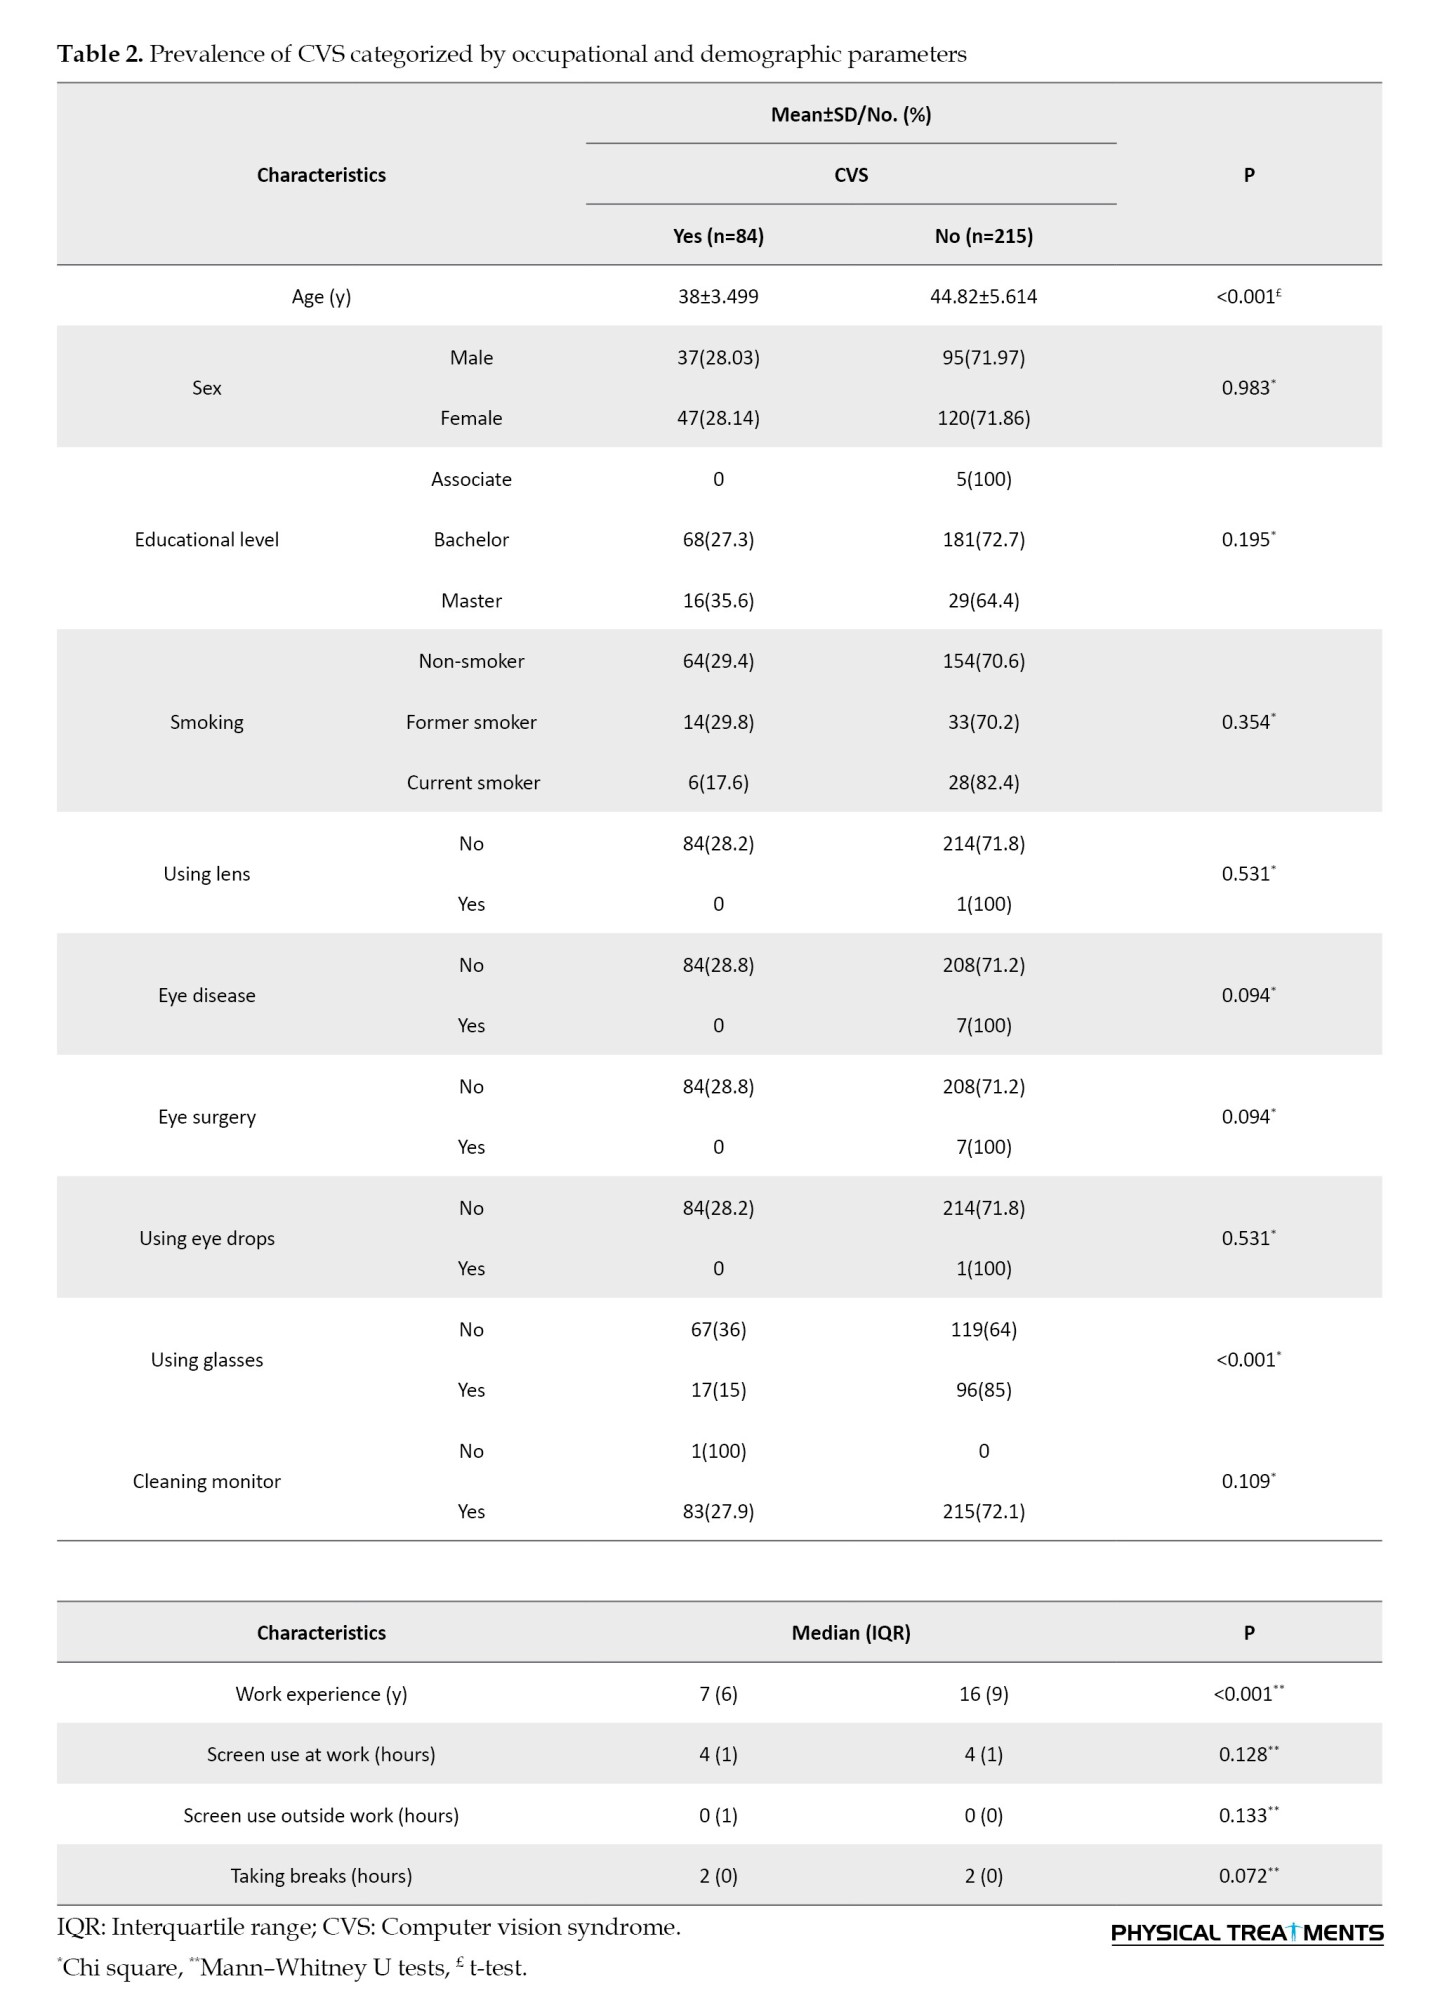
Conversely, Figure 2 shows that an examination of the parameters based on the severity of the outcomes yielded analogous findings. Table 2 delineates CVS prevalence, stratified by occupational and demographic variables. Notably, Table 2 highlights statistically significant differences (P<0.05) in age, eyeglasses use, and occupational history between individuals with and those without the condition. CVS symptoms decreased with increasing age, work experience, and the use of eyeglasses.
SQ
This constituted an additional variable to be investigated in this study. The investigation demonstrated that approximately 79% of the participants experienced suboptimal SQ. Table 3 presents the outcomes of this variable, stratified by demographic and occupational parameters.
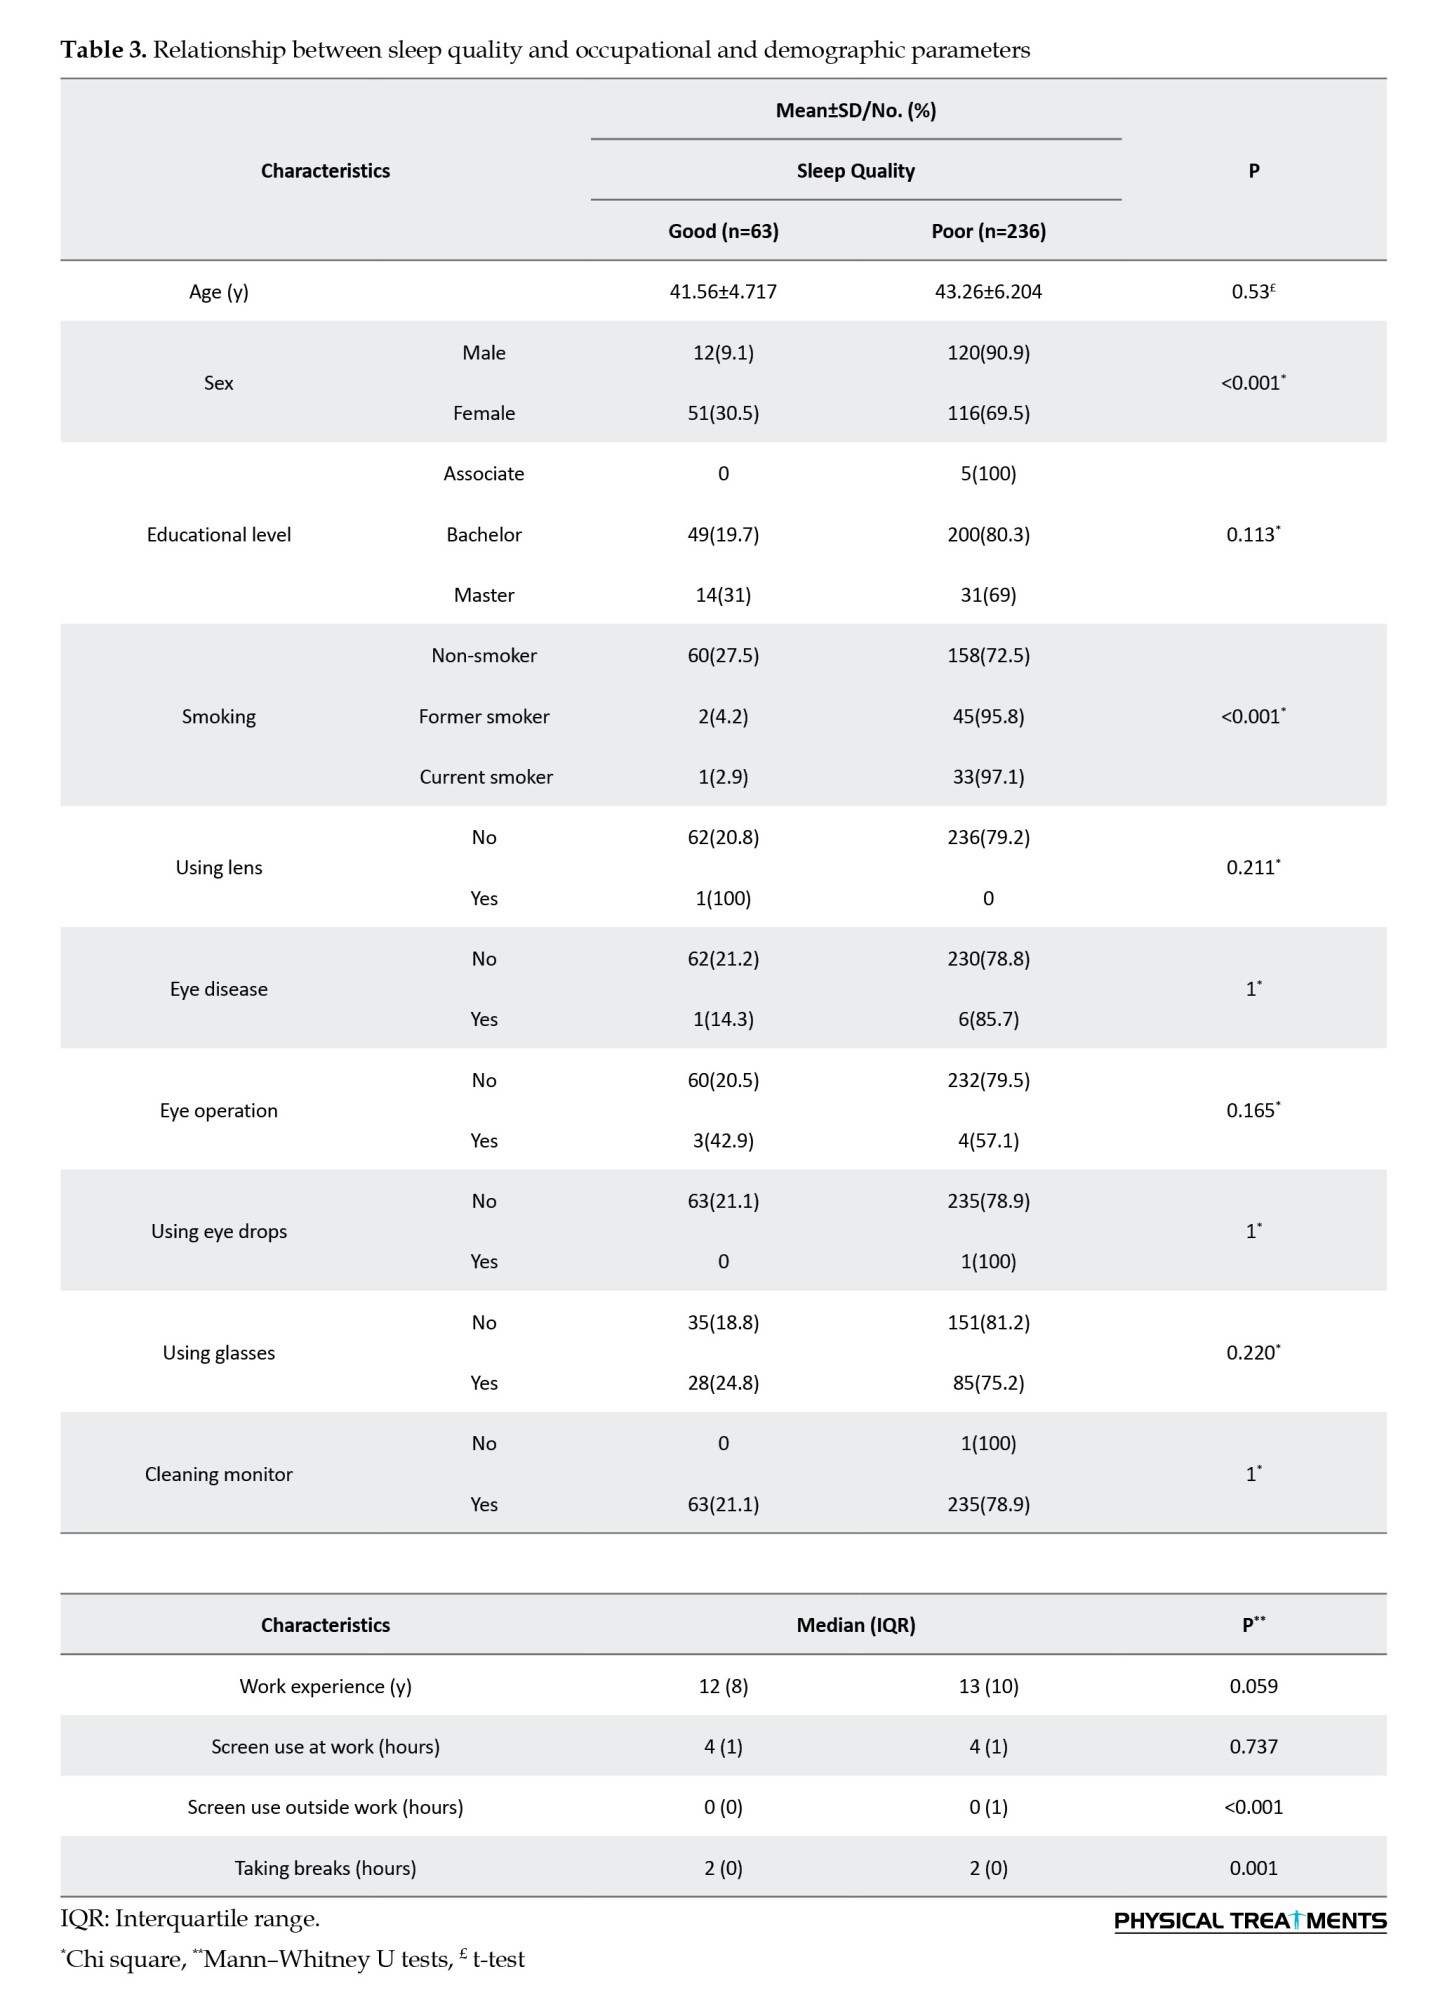
The data in this table revealed a statistically significant correlation between SQ and sex, smoking behavior, off-duty monitor utilization, and breaks (P<0.05).
Relationship between CVS and SQ about monitor use variables
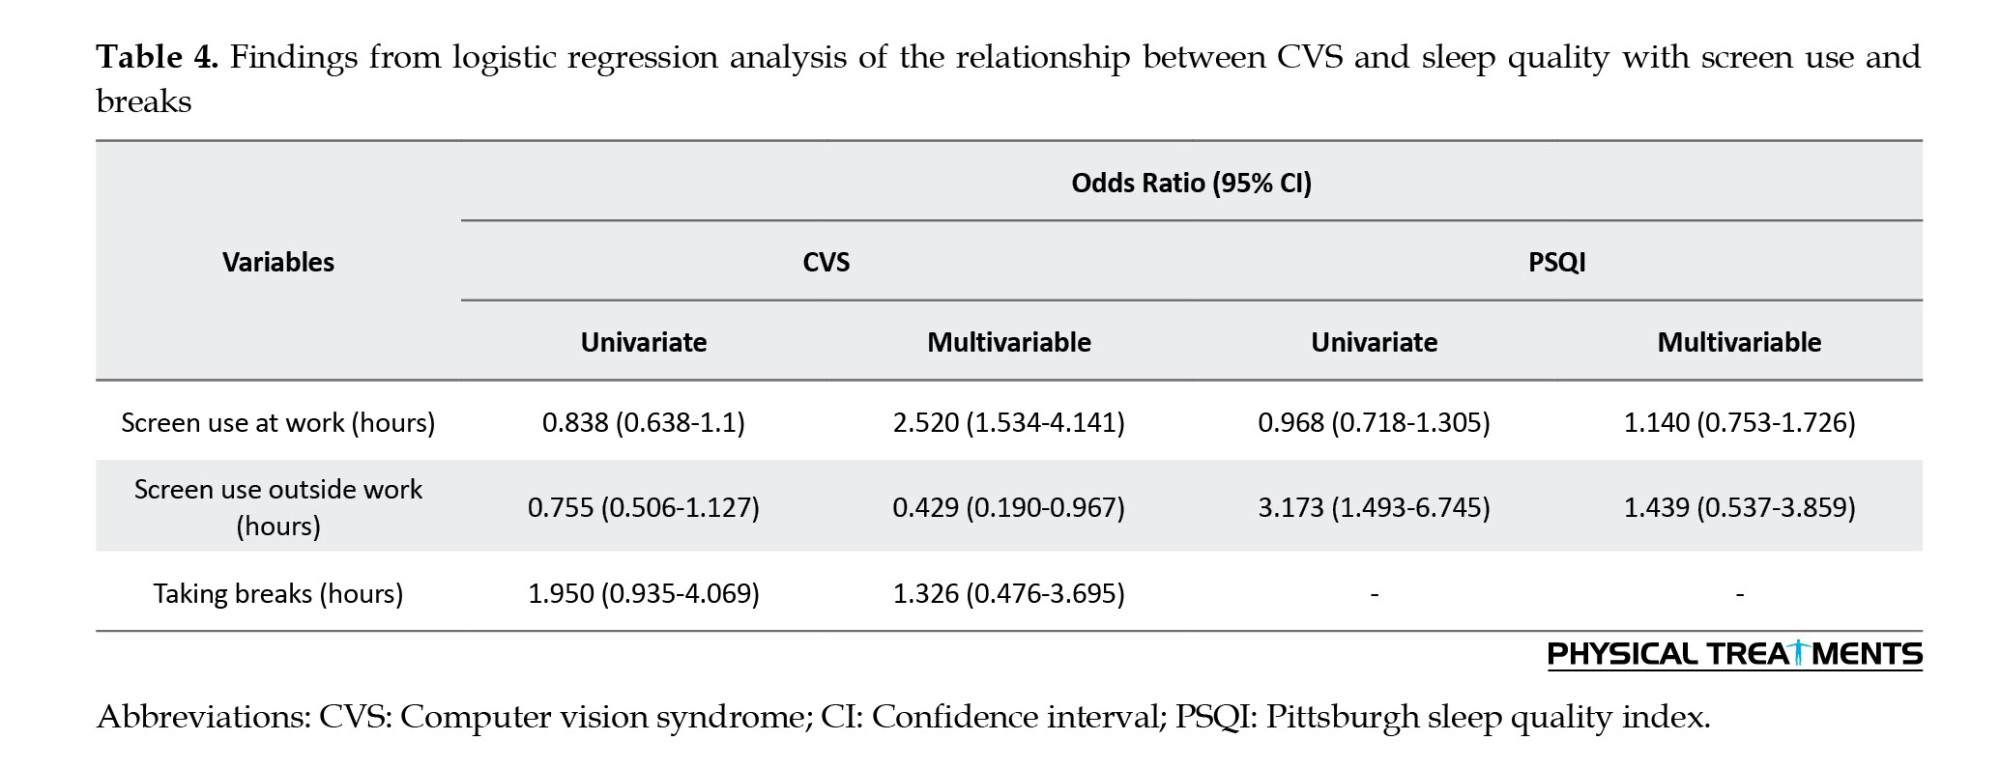
Logistic regression analysis was conducted to explore the relationship between CVS, SQ, and monitor use variables. Covariates, including age, sex, marital status, education level, smoking habits, corrective lens use, eye drop utilization, eye surgery, and medical history, were considered. The analysis revealed that each additional hour of occupational monitor usage was associated with a 2.52 times increase in the probability of experiencing CVS symptoms. Conversely, non-occupational monitor use beyond regular work hours was inversely correlated with CVS. However, the relationship between non-occupational monitor use and suboptimal SQ was not statistically significant (Table 4).
Discussion
Advancements in modern technologies have led to substantial integration of computer-based operations in the activities of administrative personnel. Despite the undeniable simplification of numerous tasks facilitated by these tools, their users remain consistently exposed to digital screens. This prolonged exposure has the potential to influence the manifestation of CVS-related symptoms and the overall SQ of individuals. Notably, such symptoms tend to occur more frequently in settings where adherence to safety and health principles is comparatively lax. The primary objective of this study was to investigate the correlation between CVS prevalence and SQ among administrative personnel at a university center in Iran, considering the extent of digital device usage.
Prevalence of CVS
In this investigation, the reported prevalence of CVS was approximately 28%, representing a relatively lower figure than that in previous studies conducted across diverse communities. The realm of studies targeting university students has been prolific, as exemplified by a study exploring CVS prevalence among Thai university students during the COVID-19 pandemic by Wangsan et al. Their findings demonstrated a strikingly high rate of 81% among students experiencing CVS [31]. The discrepancy between these rates could be attributed, in part, to the notable shift toward online classes during the pandemic, contributing to an extended duration of monitor exposure within this demographic. Additionally, the increased integration of new technologies among the student population may underlie cumulative effects on the ocular health of this generation, characterized by heightened monitor usage since childhood [36].
Similar investigations have been conducted in analogous settings, such as a study among Ethiopian bank employees in 2021, which estimated the prevalence of CVS to be approximately 74% [37]. Another study focusing on government employees in the same country revealed that over 68% of the population exhibited CVS symptoms [38]. Tesfaye et al. examined CVS among university employees in Gondar and found that 78.8% of volunteers displayed CVS symptoms [39]. The higher prevalence rates observed in these studies may be linked to disparities in the CVS definition. Unlike the present study, which required the presence of at least one symptom for classification as affected, some prior studies considered the existence of any CVS sign as a criterion.
In a study involving 2 210 administrative employees, Ranasinghe et al. reported a prevalence of approximately 67% [40]. Similar to the present investigation, the presence of at least one symptom persisting for a minimum of one week served as an indicator of CVS. A study of administrative staff at a university in Ghana reported a CVS prevalence of 51.5% [41]. Furthermore, an Egyptian study in 2021 involving information technology employees revealed that 81.5% of participants reported CVS symptoms [42]. The elevated prevalence reported in this study may be attributed to the nature of the employees’ work, which is closely associated with extensive computer usage.
The variations in prevalence rates across these studies could also be attributed to differences in methodologies, workplace environments, sample sizes, and levels of awareness regarding the risks and safe usage methods of monitors [2, 38].
Symptoms of CVS
In the current investigation, the predominant symptoms observed in the participants included heightened light sensitivity, eyelid heaviness, eye irritation, tearing, and difficulty concentrating. These findings are consistent with a study conducted among students in Peru, where eye irritation, tearing, and increased sensitivity to light were identified as the top five prevalent CVS symptoms [43]. Moreover, eye irritation has been consistently documented as a prevailing symptom across various studies [15, 39, 42]. In a study by Abudawood et al. focusing on university students in Saudi Arabia, tearing and increased sensitivity to light were recognized as the most common symptoms of CVS [44]. Another study among bank employees in Ethiopia identified common symptoms, such as eye irritation, redness, headaches, and blurred vision [37]. In an examination of CVS prevalence among Nepalese employees using monitors, eyestrain, dry eyes, and headache emerged as the three most frequently reported symptoms [45].
One of the visual complications of working with digital devices is permanent change in focus. The images and font sizes on the monitor change rapidly, causing the eyes to be constantly focused. Therefore, this action creates pressure on the eye muscles, leading to eye-related consequences [30]. However, blinking provides moisture to the eye surface through tears. However, during computer use, the blinking rate decreases, leading to drying of the corneal surface and a sensation of eye irritation. Furthermore, tear evaporation due to a reduced blinking rate can lead to increased sensitivity to light or tearing [46]. Environmental factors, such as brightness, can also increase sensitivity to light [47]. In addition, some studies have shown that excessive screen time can lead to concentration difficulties [48].
CVS risk factors
In this study, a significant correlation was observed between the use of glasses and a reduction in the incidence of CVS. In this regard, Akowuah et al. demonstrated that the use of glasses is associated with a reduction in CVS symptoms [11]. Furthermore, Lemma et al. observed that users of glasses had a 54.9% lower likelihood of experiencing CVS symptoms [38]. The use of glasses prescribed by a physician helps alleviate eye strain and visual fatigue [11]. Failure to correct vision problems can lead to difficulty in concentration and, consequently, the occurrence of visual symptoms, such as eyestrain and fatigue during the use of digital displays [31]. Glasses can be made from materials that protect the eyes from the harmful blue light emitted from screens [38, 49]. Melatonin primarily affects sleep by regulating the sleep-wake cycle. Disruptions in melatonin secretion, often caused by exposure to blue light from screens, can interfere with sleep. Poor SQ resulting from disruptions to the circadian rhythm can exacerbate CVS symptoms. A lack of sleep may increase eye strain and make individuals more sensitive to discomfort from prolonged screen use. Das et al. also demonstrated that the lack of preventive measures, such as wearing glasses, contributes to a higher prevalence of CVS [45]. However, Canto-Sancho et al. found no relationship between the use of glasses and the occurrence of CVS symptoms [1]. This is in contrast to other studies in different populations that have shown an increased likelihood of developing CVS symptoms with the glasses use [43, 50]. This difference may be attributed to the non-use of suitable or standard glasses prescribed by specialists [11, 51].
This study demonstrated a significant relationship between age and the occurrence of CVS symptoms, revealing a reduction in the incidence of CVS with advancing age. This finding aligns with the study conducted by Canto Sancho among Spanish university students [1]. In the study by Wangsan et al. age was identified as a preventive variable among specific groups of students, potentially attributed to increased participation in online classes by younger age groups compared with older students [31]. However, Zenbaba et al. revealed that individuals aged >44 years have a higher likelihood of developing CVS [2]. Similar results were observed in a previous study [52]. Conversely, some studies found no significant correlation between age and CVS occurrence [40, 41].
To further investigate, a correlation test was conducted between the age of employees and the duration of monitor use, revealing a significant inverse correlation between age and duration of screen time (r=-0.492, P<0.001). This could explain the higher prevalence of CVS symptoms among younger employees in this study.
Younger employees likely spend more time on screens than older employees due to factors, such as their roles in technology-driven or office jobs, where screen use is more intensive. They are also more comfortable with technology and may engage in prolonged screen time for both work and personal activities, such as social media and online learning. In contrast, older employees may have less screen-dependent jobs, be more aware of the risks of prolonged screen use, and take more frequent breaks or limit their exposure. These differences in screen time habits and job types could explain why younger employees reported more CVS symptoms despite their higher screen time.
However, it is worth mentioning that with increasing age, normal functioning of ocular tissues is lost, leading to visual impairments in individuals [53, 54]. Issues, such as dry eyes and cataracts are among these impairments [55]. Therefore, in older individuals with similar conditions, there may be a higher expectation of the manifestation of visual symptoms.
In this investigation, the results of multiple regression analysis revealed a significant correlation between the number of hours spent on screen use and the occurrence of CVS. Specifically, the duration of monitor usage in the workplace was directly associated with CVS onset. Each additional hour of screen use increased the likelihood of experiencing CVS symptoms by 2.52 times. Conversely, screen use outside the workplace was inversely correlated with CVS occurrence. In this context, Canto-Sancho et al. demonstrated that using visual display terminals (VDTs) for more than 4 hours per day triples the likelihood of CVS compared with 2 hours per day. However, no significant association was observed between CVS and the total use of visual display terminals (VDTs) (both work-related and leisure) [1]. The rationale for this discrepancy may lie in the distinct nature of these activities and, consequently, the differing cognitive demands, leading to varying CVS risk profiles.
Tika et al. [56] did not observe a significant correlation between computer use and CVS. However, other studies have reported a link between the duration of digital device use and the onset of CVS symptoms [11, 30, 43]. Prolonged use of a monitor and increased focus on it reduce the blink rate and diminish the secretion capacity of eye-related glands. This results in a suboptimal distribution of tears on the ocular surface, generating ocular discomfort.
In the present study, it was also established that the frequency of taking breaks and CVS were not significantly correlated with each other. Similarly, Abudawood et al. found no relationship between taking breaks and the occurrence of CVS [44]. This result was observed among administrative staff, medical students, and nursing students in other studies [12, 57]. In contrast, Coronel-Ocampos et al. demonstrated that taking breaks every 20 minutes and every hour can reduce the prevalence of CVS by 6% and 7%, respectively [50]. A similar association has been reported in a previous study [58]. Taking breaks contributes to the relaxation of the eye muscles, reducing eyestrain [59]. The differences in the results of various studies may stem from variations in the definition of individuals’ taking breaks habits [37]. Additionally, variations in the quality and manner of taking breaks among individuals could contribute to divergent study outcomes.
In this study, work experience also demonstrated a significant correlation with CVS occurrence, indicating that individuals with longer work experience are less prone to CVS. This contrasts with the findings of Derbew et al. who suggested that individuals with five or more years of experience reported a higher prevalence of CVS [37]. This result has been replicated in other studies, suggesting that prolonged computer use can lead to persistent complaints that may persist even after the discontinuation of work-related activities. This may be attributed to the cumulative nature of CVS symptoms [39, 42]. Consequently, prolonged screen exposure increases cumulative stress on the eyes, intensifying the risk of developing CVS [39]. However, in previous studies conducted among bank employees, no significant relationship was observed between work experience and CVS occurrence [41, 51]. Therefore, it can be asserted that the nature of previous work may not have been sufficiently automation-oriented. Conversely, the correlation between the age of employees and the duration of monitor use also indicated that younger individuals, who naturally have less work experience, spend more time on the monitor, which could contribute to the higher prevalence of CVS in this demographic.
In this study, 80% of the volunteers had inadequate SQ. In a study investigating the impact of mobile phone addiction on SQ among medical students, 51.3% were identified with inadequate SQ [12]. In another study, 76% of medical students in Saudi Arabia reported poor SQ [60]. In a study of Indonesian adults, 30.4% reported poor SQ [61]. In a study conducted among digital device users in Ghana, 62.43% of students had suboptimal SQ [11]. This variation across different studies is likely due to the use of different methods in estimating SQ or differences in the duration of device use.
Risk factors of SQ
The Kaiser Score test demonstrated a significant relationship between SQ and screen use after working hours. Logistic regression analysis also indicated that for each additional hour of monitor use outside office hours, the likelihood of experiencing poor SQ increased by a factor of 1.4. However, this relationship was not statistically significant. Previous studies have also shown a connection between the use of digital devices and sleep problems [11, 62]. Multiple mechanisms exist in the relationship between screen time and sleep disorders. More precisely, the timing of screen use can affect SQ by altering the timing or duration of sleep, especially when used in the bedroom. Using these devices during sleep can evoke emotions or engage thoughts, delaying falling asleep and reducing sleep duration. In addition, the blue light emitted from screens may suppress or delay the secretion of melatonin, a hormone that plays a role in sleep mechanisms [63].
In the present study, a significant difference in SQ was observed between women and men, with men experiencing lower SQ. Overall, the results of studies on the relationship between sex and SQ have been mixed and debatable. Cultural and ethnic differences between societies may be potential factors contributing to variations in study outcomes. Consistent with the findings of the current study, Yang et al. conducted a study on workers and found that poor SQ is more prevalent among men [64]. Similar results have been reported in other studies [65, 66]. However, Kumar et al. did not find a significant difference between the two sexes [67]. This discrepancy could be attributed to the different scoring methods for men and women in the SAS-SV questionnaire. Furthermore, the current study contradicts numerous previous studies [68, 69]. The higher prevalence of sleep disorders in women in societies could be another contributing factor [70]. Traditionally, women, especially older women, often bear household responsibilities, which, given the nature and timing of these tasks, may be associated with chronic conditions, including sleep disorders [69].
In this study, a significant relationship was observed between taking breaks and SQ. Taking breaks during work can enhance SQ and reduce somatic symptoms [71]. A study on hospital employees also indicated that taking breaks during work significantly reduced the incidence of insomnia [72]. Furthermore, this study showed that cigarette smoking decreased SQ. Previous studies, including large community cohorts, have shown that smokers have lower SQ and more insomnia-related symptoms than non-smokers [73, 74]. In reality, smokers have lower levels of striatal dopamine, a neurotransmitter associated with cognitive function and SQ in healthy individuals [75-77].
Beyond these findings, this study raises important concerns about the broader implications of prolonged screen use by administrative staff. Extended screen time can lead to a range of occupational health risks, such as eye strain, headaches, blurred vision, and musculoskeletal problems, including neck and shoulder pain. These issues are compounded by the potential disruption of sleep patterns, as prolonged exposure to screens, especially before bedtime, negatively impacts circadian rhythms, further exacerbating SQ.
Given the prevalence of screen-based work in modern office environments, these health risks are significant for administrative staff who spend long hours on computers. The findings of this study suggest that organizations should consider implementing comprehensive workplace policies to mitigate the negative effects of prolonged screen use. Such policies could include ergonomic interventions, such as adjustable desks, proper lighting, and screen positioning, to reduce physical strain. Additionally, encouraging regular breaks, promoting the use of blue light filters, and educating employees on the importance of sleep hygiene and eye care can significantly improve their overall well-being and productivity.
By adopting these measures, employers can help reduce the incidence of CVS and improve SQ, ultimately fostering a healthier and more productive workforce.
Conclusion
This study indicated that CVS is prevalent among administrative staff at universities. Age, work experience, and use of glasses showed significant differences between individuals affected by CVS and those without the syndrome. Additionally, the SQ of most participants was assessed as unfavorable. The examination of associated risk factors indicated that SQ was unfavorable in men, smokers, individuals without a habit of taking breaks, and those who used screens outside the workplace. The regression analysis results also demonstrated that monitor usage in the workplace increased the likelihood of experiencing CVS symptoms. Specifically, each additional hour of screen usage was associated with 2.52 times increased probability of CVS symptoms. Moreover, increased use of high-quality screens was directly related to poor SQ, although this association was not statistically significant. Considering the long-term impact of screen usage on the occurrence of CVS and sleep disorders, and their influence on individual’s quality of life and performance, it is recommended to implement appropriate safety and health measures to reduce the prevalence of these factors:
Regular breaks: Employees should be encouraged to take short breaks to reduce eye strain and minimize the impact of prolonged screen use. Ergonomic interventions: Provide ergonomic workstations, such as adjustable desks, chairs, and monitor stands, to reduce the physical strain associated with extended screen use. Blue light filters: Implement blue light filters or adjust screen settings to reduce exposure to blue light, which can affect eye health and SQ, especially during evening hours. Education and awareness: Provide training on proper screen usage, posture, and the importance of regular breaks, as well as educate employees about sleep hygiene to improve their overall well-being.
Limitations
This study had several limitations. First, direct ergonomic measurements, such as monitor distance and ambient lighting, were not included, which could have provided a more comprehensive understanding of the factors influencing CVS and SQ. Additionally, the cross-sectional design of this study limits the ability to draw causal inferences, as it only captures a snapshot of the variables at a single point in time, rather than examining changes over a longer period. This study recognizes the limitation of using a questionnaire-based approach, as self-reported data can introduce inherent biases in measuring both CVS and SQ. Participants’ reported screen usage may also be inaccurate, affecting the reliability of the results, and practical tests for measuring vision and SQ, which offer greater precision, were not conducted. In addition, the reported screen usage by participants may contain some inaccuracies.
Suggestions for future research
To improve the objectivity of future studies and minimize these biases, we recommend using objective measures in conjunction with self-reported data. For instance:
Screen time tracking: Objective data on screen usage can be obtained through tracking software or devices that record actual screen time, thus reducing the potential for recall bias and providing more accurate exposure measurements.
Sleep monitors: The use of wearable devices or actigraphy to monitor sleep patterns offers objective data on SQ, duration, and disturbances. These devices provide real-time measurements, which would improve the reliability of SQ assessments compared to self-reported data.
By incorporating these objective measures, future studies could enhance the validity and accuracy of their findings, leading to a clearer understanding of the relationship between screen usage, CVS, and SQ.
Ethical Considerations
Compliance with ethical guidelines
This study was approved by the Ethics Committee of Shahid Beheshti University of Medical Sciences, Tehran, Iran (Code: IR.SBMU.RETECH.REC.1401.868).
Funding
This research did not receive any grant from funding agencies in the public, commercial, or non-profit sectors.
Authors' contributions
All authors contributed equally to the conception and design of the study, data collection and analysis, interception of the results, and manuscript drafting. Each author approved the submission of the final version of the manuscript.
Conflict of interest
The authors declared no conflict of interests.
Acknowledgments
The authors extend their gratitude to the employees of Shahid Beheshti University of Medical Sciences for their coordination during this study
References
In recent decades, significant technological progress has transformed the use of computers and video terminals into an integral part of our personal lives [1, 2]. Today, almost every institution, department, and organization uses computers for various activities, such as typing, design, computing, and communication [3]. Although these devices offer numerous benefits in terms of communication, productivity, and entertainment, concerns have been raised about their potential negative effects on health and well-being [4, 5]. During the COVID-19 pandemic, reliance on digital devices surged for people in both work and educational settings [6-8].
Computer vision syndrome (CVS) is a collection of visual problems associated with activities related to or performed while using computers [9, 10]. The most common symptoms include eye irritation, fatigue, redness, stimulation, tearing, blurred vision, color vision disturbances, headache, and light sensitivity [11, 12]. Approximately 60 million computer users worldwide suffer from CVS, with nearly one million new cases added annually [11]. Many studies have shown a high prevalence of CVS (60-90%) among users of digital displays [13-16]. It also affects the quality of life, including sleep quality (SQ) and stress, and consequently reduces productivity [11]. Adequate sleep duration and quality are crucial components of an individual’s physical and emotional health [17].
Today, the impact of long-term digital device use on sleep has become a concern, causing a significant decrease in the quantity and quality of sleep [11, 18]. This issue is especially relevant in the workplace, where prolonged screen time can lead to sleep disturbances and decreased productivity. Poor sleep affects cognitive functions, such as attention, memory, and decision-making, leading to decreased focus and slower task completion. It also contributes to mood disturbances, fatigue, and increased errors, all of which reduce workplace productivity.
A study conducted in Croatia during the lockdown investigated the use of digital technology (DT), SQ, and the relationships between these factors in children and their parents [19]. The findings revealed differing impacts of DT use on SQ between the two groups. For parents, no significant relationship was found between DT use and SQ. In contrast, prolonged smartphone use for leisure among children was negatively associated with SQ.
A retrospective cohort study explored the relationship between the incidence of sleep problems and changes in digital media usage among university students in Japan during the COVID-19 pandemic [20]. Students who reported an increase in digital media use between 2019 and 2020 were found to have a higher risk (odds ratio [OR]: 1.76; 95% confidence interval [CI], 1.21%, 2.55%) of experiencing sleep problems in 2020.
Difficulty falling asleep, recurrent nighttime, sleep disturbances, and snoring are reported in the wake of sleep problems [21]. Prolonged exposure to light emitted by electronic devices, such as computer screens and cell phones, causes changes in nocturnal sleep patterns and suppresses melatonin levels, which in turn affect SQ [22, 23].
Several studies have found that a significant portion of the general population spends at least nine hours per day engaging with digital devices [24-26]. This extensive usage has been linked to addictive behaviors. One study demonstrated that individuals with excessive smartphone usage exhibited notable deficits in the early stages of inhibition processing [27]. Consequently, examining the impact of computer usage among office workers, who typically have prolonged exposure to digital devices, is of paramount importance.
Some previous research on the ocular effects of digital device use primarily focused on users who utilized cathode ray tube (CRT) displays [28]. In contrast, contemporary professional computer users predominantly employ laptops or other flat LCD or LED screens, which may differ from CRTs in terms of visual ergonomics and potentially influence the development of ocular symptoms. Therefore, new studies are required to investigate the impact of using these advanced monitoring devices.
These studies have predominantly been conducted among university students, with one study utilizing a web-based survey, thus limiting respondents to social media and Internet users [1, 2, 29-31]. Consequently, the findings may not be representative of other population groups, such as office workers, due to factors, such as differences in monitor usage and varying work hours.
While previous research has primarily focused on the ocular effects of digital device use in the general population or among university students, few studies have explored the impact of prolonged screen time on office workers. Given that office workers often experience extended exposure to digital devices, this demographic requires further investigation. Additionally, most studies have focused on traditional CRT displays; however, modern devices, such as laptops and LCD/LED screens, may present different ergonomic challenges.
Additionally, the high prevalence of CVS symptoms reported in previous studies (97.9%, 77.5%, 81%, and 48.7%) underscores the necessity of investigating these symptoms among other demographic groups [29-32].
Furthermore, the associated factors of CVS are scarce and inconsistent. For example, Canto-Sancho et al. identified headache and itching as the most frequent symptoms, whereas other studies reported blurred vision, eye pain, and redness as predominant issues [1, 2, 31].
To the best of our knowledge, no study has examined the relationship between the prevalence of CVS and the SQ with the use of digital devices in Iran. This study aims to provide baseline data that can assist public health professionals in developing effective strategies to address this emerging public health concern.
This study aimed to examine the hypothesis that increased use of electronic devices among administrative staff at a university center is associated with a higher prevalence of CVS and poorer SQ. The results of this study can provide essential health information for administrative staff working with video terminals daily. By examining the prevalence of CVS and its relationship with SQ among administrative staff at a university, this study can inform health policies and provide insights into improving workplace productivity by addressing the impact of digital device use on SQ.
Materials and Methods
This cross-sectional study was conducted among administrative staff in Tehran City, Iran, in 2023. The study population consisted of all employees in the office sector with a minimum of one year’s work experience and no history of musculoskeletal disorders. Musculoskeletal disorders, particularly those affecting the neck, back, or shoulders, can affect posture and ergonomics, which may exacerbate CVS symptoms or disrupt sleep. By excluding these individuals, we aimed to control for potential confounding factors. The sample size was calculated based on the prevalence of CVS reported in previous studies (approximately 49%) with a 5% margin of error as mentioned in Equation 1.
Where, “Z” is the Z-score corresponding to the desired confidence level (e.g. 1.96 for 95% confidence). “p” is the estimated prevalence or proportion (e.g. 0.5 if unknown). “e” is the margin of error (e.g. 0.05 for ±5%). “N” is the total population size.
Considering the specific statistical volume for population size of 1500 people, approximately 300 individuals were eligible for inclusion in the study. Due to difficulties in coordination and accessibility, only staff working at the university’s headquarters were included. Simple random sampling was applied by directly selecting participants from the headquarters population, ensuring equal chances of selection without relying on pre-made lists or identification numbers [33]. After determining the number of samples, a simple random sampling method was used to select the study participants.
Data collection
In this study, the conditions of university employees were first examined to select the sample according to the sample size and criteria for participation in the study. Written consent was obtained from the employees to obtain the required information. In this study, information on CVS and SQ was collected using a questionnaire. In addition, information about individuals’ characteristics (age, history, working hours, gender and education) was collected. The Persian version of the Pittsburgh SQ index (PSQI) questionnaire was used to assess SQ [34]. The translation involved independent translations by two fluent English-speaking native Iranians, followed by reconciliation and back-translation into English by a bilingual native speaker. The final version was pilot-tested on 12 subjects and approved by an expert panel for conceptual and linguistic equivalence. Cronbach’s α coefficient was 0.77. The corrected item–total correlations ranged from 0.30 to 0.75 for the seven PSQI component scores. The sensitivity and specificity were 94% and 72% for a PSQI cutoff value of 5 and 85% and 84% for a PSQI cutoff value of 6. The questionnaire consists of seven components, each scored from 0 to 3. The components include a general description of SQ, sleep latency, adequacy of sleep, sleep disturbance, and morning performance. Finally, the scores of each component were aggregated and converted into a total score (0-21). Higher scores in each component or the overall score indicate poor SQ. Scores of 0, 1, 2, and 3 on each scale represent normal situations and the presence of mild, moderate, and severe problems, respectively. A total score >6 indicates inadequate SQ. The Persian version of the CVS standard questionnaire was used to investigate CVS [35]. Similar to the PSQI, the CVS questionnaire was translated and adapted to the Persian context through a detailed process. First, two bilingual translators independently translated the English version into Persian. After reconciling the two translations, the version was back-translated into English by two bilingual translators to ensure the accuracy and consistency of the translation. A panel of experts reviewed the back-translations and compared them with the original version to ensure that the meaning was preserved and the terminology was culturally appropriate. As recommended by the ISPOR translation and cultural adaptation (TCA) guidelines, cultural adaptations were made to ensure that the terminology reflected local practices and was contextually relevant to Persian-speaking individuals. This questionnaire demonstrated a strong sensitivity of 81.1% and satisfactory specificity of 69.2%. Additionally, it exhibited good internal consistency with a Cronbach’s α of 0.80 and reliable test–retest consistency, reflected by an intraclass correlation coefficient (ICC) of 0.81 and a κ of 0.65.
The questionnaire covers the frequency and intensity of 16 visual signals associated with visual disturbances. The total score for each indicator was determined by summing the frequency and intensity, and the final score was then calculated. If this score is above 6, it means that the person suffers from CVS.
Data analysis
Data were analyzed using SPSS software, version 26, and descriptive statistics were used for all variables. The Mean±SD, median, and interquartile range (IQR) were used for continuous variables, and percentage for qualitative variables. Prior to conducting statistical tests, the data were assessed for normality using the Kolmogorov–Smirnov test. Based on the results of the normality tests, appropriate statistical tests were selected. Chi-square, Mann-Whitney, and t-tests were used to examine the relationship between the occurrence of CVS and risk factors about variable type. The mean significance level for all tests was 5%. A similar trend was observed when evaluating potential factors affecting SQ.
A regression analysis was conducted to assess the relationship between CVS and SQ, including variables, such as monitor use at work and outside of work, and taking breaks. Initially, variables were included in a binary logistic regression model, and those with P<0.2 were advanced to a multivariable logistic regression model. This approach aimed to evaluate the association between monitor use, taking breaks, and CVS and SQ. The results were presented as ORs with 95% CI.
The results of the logistic regression analysis were used to examine the relationship between CVS and SQ, with variables, including monitor use at work and outside of work, and taking breaks, adjusted for variables, including age, gender, marital status, education level, smoking, use of contact lenses, glasses, and eye drops, monitor cleaning, eye surgery, eye diseases, and work experience.
Results
Demographic and occupational characteristics
A total of 299 questionnaires were collected from administrative staff at a specific university center in Iran. The mean age of participants was 42.9 years (range: 29-59) with a gender distribution of 44.1% male and 55.9% female. Among the participants, 27.1% reported a history of smoking. Additionally, regular screen cleaning (99.7%) was the most frequently reported visual intervention. Participants spent an average of 4.25 hours per day using a monitor at work, with 2-6 hours dedicated to this activity. Outside of work hours, individuals used a monitor for an average of 0.33 hours, and allocated 1.89 hours for breaks during work (Table 1).
Prevalence of CVS
This study found that approximately 28.1% of the participants exhibited symptoms indicative of CVS. The mean CVS score of the participants was 7.78, ranging from 0 to 20. All participants in the study manifested at least one symptomatic feature. As depicted in Figure 1, heightened light sensitivity, eyelid heaviness, and eye irritation were identified with the highest frequency among the various symptoms associated with CVS.
Conversely, Figure 2 shows that an examination of the parameters based on the severity of the outcomes yielded analogous findings. Table 2 delineates CVS prevalence, stratified by occupational and demographic variables. Notably, Table 2 highlights statistically significant differences (P<0.05) in age, eyeglasses use, and occupational history between individuals with and those without the condition. CVS symptoms decreased with increasing age, work experience, and the use of eyeglasses.
SQ
This constituted an additional variable to be investigated in this study. The investigation demonstrated that approximately 79% of the participants experienced suboptimal SQ. Table 3 presents the outcomes of this variable, stratified by demographic and occupational parameters.
The data in this table revealed a statistically significant correlation between SQ and sex, smoking behavior, off-duty monitor utilization, and breaks (P<0.05).
Relationship between CVS and SQ about monitor use variables
Logistic regression analysis was conducted to explore the relationship between CVS, SQ, and monitor use variables. Covariates, including age, sex, marital status, education level, smoking habits, corrective lens use, eye drop utilization, eye surgery, and medical history, were considered. The analysis revealed that each additional hour of occupational monitor usage was associated with a 2.52 times increase in the probability of experiencing CVS symptoms. Conversely, non-occupational monitor use beyond regular work hours was inversely correlated with CVS. However, the relationship between non-occupational monitor use and suboptimal SQ was not statistically significant (Table 4).
Discussion
Advancements in modern technologies have led to substantial integration of computer-based operations in the activities of administrative personnel. Despite the undeniable simplification of numerous tasks facilitated by these tools, their users remain consistently exposed to digital screens. This prolonged exposure has the potential to influence the manifestation of CVS-related symptoms and the overall SQ of individuals. Notably, such symptoms tend to occur more frequently in settings where adherence to safety and health principles is comparatively lax. The primary objective of this study was to investigate the correlation between CVS prevalence and SQ among administrative personnel at a university center in Iran, considering the extent of digital device usage.
Prevalence of CVS
In this investigation, the reported prevalence of CVS was approximately 28%, representing a relatively lower figure than that in previous studies conducted across diverse communities. The realm of studies targeting university students has been prolific, as exemplified by a study exploring CVS prevalence among Thai university students during the COVID-19 pandemic by Wangsan et al. Their findings demonstrated a strikingly high rate of 81% among students experiencing CVS [31]. The discrepancy between these rates could be attributed, in part, to the notable shift toward online classes during the pandemic, contributing to an extended duration of monitor exposure within this demographic. Additionally, the increased integration of new technologies among the student population may underlie cumulative effects on the ocular health of this generation, characterized by heightened monitor usage since childhood [36].
Similar investigations have been conducted in analogous settings, such as a study among Ethiopian bank employees in 2021, which estimated the prevalence of CVS to be approximately 74% [37]. Another study focusing on government employees in the same country revealed that over 68% of the population exhibited CVS symptoms [38]. Tesfaye et al. examined CVS among university employees in Gondar and found that 78.8% of volunteers displayed CVS symptoms [39]. The higher prevalence rates observed in these studies may be linked to disparities in the CVS definition. Unlike the present study, which required the presence of at least one symptom for classification as affected, some prior studies considered the existence of any CVS sign as a criterion.
In a study involving 2 210 administrative employees, Ranasinghe et al. reported a prevalence of approximately 67% [40]. Similar to the present investigation, the presence of at least one symptom persisting for a minimum of one week served as an indicator of CVS. A study of administrative staff at a university in Ghana reported a CVS prevalence of 51.5% [41]. Furthermore, an Egyptian study in 2021 involving information technology employees revealed that 81.5% of participants reported CVS symptoms [42]. The elevated prevalence reported in this study may be attributed to the nature of the employees’ work, which is closely associated with extensive computer usage.
The variations in prevalence rates across these studies could also be attributed to differences in methodologies, workplace environments, sample sizes, and levels of awareness regarding the risks and safe usage methods of monitors [2, 38].
Symptoms of CVS
In the current investigation, the predominant symptoms observed in the participants included heightened light sensitivity, eyelid heaviness, eye irritation, tearing, and difficulty concentrating. These findings are consistent with a study conducted among students in Peru, where eye irritation, tearing, and increased sensitivity to light were identified as the top five prevalent CVS symptoms [43]. Moreover, eye irritation has been consistently documented as a prevailing symptom across various studies [15, 39, 42]. In a study by Abudawood et al. focusing on university students in Saudi Arabia, tearing and increased sensitivity to light were recognized as the most common symptoms of CVS [44]. Another study among bank employees in Ethiopia identified common symptoms, such as eye irritation, redness, headaches, and blurred vision [37]. In an examination of CVS prevalence among Nepalese employees using monitors, eyestrain, dry eyes, and headache emerged as the three most frequently reported symptoms [45].
One of the visual complications of working with digital devices is permanent change in focus. The images and font sizes on the monitor change rapidly, causing the eyes to be constantly focused. Therefore, this action creates pressure on the eye muscles, leading to eye-related consequences [30]. However, blinking provides moisture to the eye surface through tears. However, during computer use, the blinking rate decreases, leading to drying of the corneal surface and a sensation of eye irritation. Furthermore, tear evaporation due to a reduced blinking rate can lead to increased sensitivity to light or tearing [46]. Environmental factors, such as brightness, can also increase sensitivity to light [47]. In addition, some studies have shown that excessive screen time can lead to concentration difficulties [48].
CVS risk factors
In this study, a significant correlation was observed between the use of glasses and a reduction in the incidence of CVS. In this regard, Akowuah et al. demonstrated that the use of glasses is associated with a reduction in CVS symptoms [11]. Furthermore, Lemma et al. observed that users of glasses had a 54.9% lower likelihood of experiencing CVS symptoms [38]. The use of glasses prescribed by a physician helps alleviate eye strain and visual fatigue [11]. Failure to correct vision problems can lead to difficulty in concentration and, consequently, the occurrence of visual symptoms, such as eyestrain and fatigue during the use of digital displays [31]. Glasses can be made from materials that protect the eyes from the harmful blue light emitted from screens [38, 49]. Melatonin primarily affects sleep by regulating the sleep-wake cycle. Disruptions in melatonin secretion, often caused by exposure to blue light from screens, can interfere with sleep. Poor SQ resulting from disruptions to the circadian rhythm can exacerbate CVS symptoms. A lack of sleep may increase eye strain and make individuals more sensitive to discomfort from prolonged screen use. Das et al. also demonstrated that the lack of preventive measures, such as wearing glasses, contributes to a higher prevalence of CVS [45]. However, Canto-Sancho et al. found no relationship between the use of glasses and the occurrence of CVS symptoms [1]. This is in contrast to other studies in different populations that have shown an increased likelihood of developing CVS symptoms with the glasses use [43, 50]. This difference may be attributed to the non-use of suitable or standard glasses prescribed by specialists [11, 51].
This study demonstrated a significant relationship between age and the occurrence of CVS symptoms, revealing a reduction in the incidence of CVS with advancing age. This finding aligns with the study conducted by Canto Sancho among Spanish university students [1]. In the study by Wangsan et al. age was identified as a preventive variable among specific groups of students, potentially attributed to increased participation in online classes by younger age groups compared with older students [31]. However, Zenbaba et al. revealed that individuals aged >44 years have a higher likelihood of developing CVS [2]. Similar results were observed in a previous study [52]. Conversely, some studies found no significant correlation between age and CVS occurrence [40, 41].
To further investigate, a correlation test was conducted between the age of employees and the duration of monitor use, revealing a significant inverse correlation between age and duration of screen time (r=-0.492, P<0.001). This could explain the higher prevalence of CVS symptoms among younger employees in this study.
Younger employees likely spend more time on screens than older employees due to factors, such as their roles in technology-driven or office jobs, where screen use is more intensive. They are also more comfortable with technology and may engage in prolonged screen time for both work and personal activities, such as social media and online learning. In contrast, older employees may have less screen-dependent jobs, be more aware of the risks of prolonged screen use, and take more frequent breaks or limit their exposure. These differences in screen time habits and job types could explain why younger employees reported more CVS symptoms despite their higher screen time.
However, it is worth mentioning that with increasing age, normal functioning of ocular tissues is lost, leading to visual impairments in individuals [53, 54]. Issues, such as dry eyes and cataracts are among these impairments [55]. Therefore, in older individuals with similar conditions, there may be a higher expectation of the manifestation of visual symptoms.
In this investigation, the results of multiple regression analysis revealed a significant correlation between the number of hours spent on screen use and the occurrence of CVS. Specifically, the duration of monitor usage in the workplace was directly associated with CVS onset. Each additional hour of screen use increased the likelihood of experiencing CVS symptoms by 2.52 times. Conversely, screen use outside the workplace was inversely correlated with CVS occurrence. In this context, Canto-Sancho et al. demonstrated that using visual display terminals (VDTs) for more than 4 hours per day triples the likelihood of CVS compared with 2 hours per day. However, no significant association was observed between CVS and the total use of visual display terminals (VDTs) (both work-related and leisure) [1]. The rationale for this discrepancy may lie in the distinct nature of these activities and, consequently, the differing cognitive demands, leading to varying CVS risk profiles.
Tika et al. [56] did not observe a significant correlation between computer use and CVS. However, other studies have reported a link between the duration of digital device use and the onset of CVS symptoms [11, 30, 43]. Prolonged use of a monitor and increased focus on it reduce the blink rate and diminish the secretion capacity of eye-related glands. This results in a suboptimal distribution of tears on the ocular surface, generating ocular discomfort.
In the present study, it was also established that the frequency of taking breaks and CVS were not significantly correlated with each other. Similarly, Abudawood et al. found no relationship between taking breaks and the occurrence of CVS [44]. This result was observed among administrative staff, medical students, and nursing students in other studies [12, 57]. In contrast, Coronel-Ocampos et al. demonstrated that taking breaks every 20 minutes and every hour can reduce the prevalence of CVS by 6% and 7%, respectively [50]. A similar association has been reported in a previous study [58]. Taking breaks contributes to the relaxation of the eye muscles, reducing eyestrain [59]. The differences in the results of various studies may stem from variations in the definition of individuals’ taking breaks habits [37]. Additionally, variations in the quality and manner of taking breaks among individuals could contribute to divergent study outcomes.
In this study, work experience also demonstrated a significant correlation with CVS occurrence, indicating that individuals with longer work experience are less prone to CVS. This contrasts with the findings of Derbew et al. who suggested that individuals with five or more years of experience reported a higher prevalence of CVS [37]. This result has been replicated in other studies, suggesting that prolonged computer use can lead to persistent complaints that may persist even after the discontinuation of work-related activities. This may be attributed to the cumulative nature of CVS symptoms [39, 42]. Consequently, prolonged screen exposure increases cumulative stress on the eyes, intensifying the risk of developing CVS [39]. However, in previous studies conducted among bank employees, no significant relationship was observed between work experience and CVS occurrence [41, 51]. Therefore, it can be asserted that the nature of previous work may not have been sufficiently automation-oriented. Conversely, the correlation between the age of employees and the duration of monitor use also indicated that younger individuals, who naturally have less work experience, spend more time on the monitor, which could contribute to the higher prevalence of CVS in this demographic.
In this study, 80% of the volunteers had inadequate SQ. In a study investigating the impact of mobile phone addiction on SQ among medical students, 51.3% were identified with inadequate SQ [12]. In another study, 76% of medical students in Saudi Arabia reported poor SQ [60]. In a study of Indonesian adults, 30.4% reported poor SQ [61]. In a study conducted among digital device users in Ghana, 62.43% of students had suboptimal SQ [11]. This variation across different studies is likely due to the use of different methods in estimating SQ or differences in the duration of device use.
Risk factors of SQ
The Kaiser Score test demonstrated a significant relationship between SQ and screen use after working hours. Logistic regression analysis also indicated that for each additional hour of monitor use outside office hours, the likelihood of experiencing poor SQ increased by a factor of 1.4. However, this relationship was not statistically significant. Previous studies have also shown a connection between the use of digital devices and sleep problems [11, 62]. Multiple mechanisms exist in the relationship between screen time and sleep disorders. More precisely, the timing of screen use can affect SQ by altering the timing or duration of sleep, especially when used in the bedroom. Using these devices during sleep can evoke emotions or engage thoughts, delaying falling asleep and reducing sleep duration. In addition, the blue light emitted from screens may suppress or delay the secretion of melatonin, a hormone that plays a role in sleep mechanisms [63].
In the present study, a significant difference in SQ was observed between women and men, with men experiencing lower SQ. Overall, the results of studies on the relationship between sex and SQ have been mixed and debatable. Cultural and ethnic differences between societies may be potential factors contributing to variations in study outcomes. Consistent with the findings of the current study, Yang et al. conducted a study on workers and found that poor SQ is more prevalent among men [64]. Similar results have been reported in other studies [65, 66]. However, Kumar et al. did not find a significant difference between the two sexes [67]. This discrepancy could be attributed to the different scoring methods for men and women in the SAS-SV questionnaire. Furthermore, the current study contradicts numerous previous studies [68, 69]. The higher prevalence of sleep disorders in women in societies could be another contributing factor [70]. Traditionally, women, especially older women, often bear household responsibilities, which, given the nature and timing of these tasks, may be associated with chronic conditions, including sleep disorders [69].
In this study, a significant relationship was observed between taking breaks and SQ. Taking breaks during work can enhance SQ and reduce somatic symptoms [71]. A study on hospital employees also indicated that taking breaks during work significantly reduced the incidence of insomnia [72]. Furthermore, this study showed that cigarette smoking decreased SQ. Previous studies, including large community cohorts, have shown that smokers have lower SQ and more insomnia-related symptoms than non-smokers [73, 74]. In reality, smokers have lower levels of striatal dopamine, a neurotransmitter associated with cognitive function and SQ in healthy individuals [75-77].
Beyond these findings, this study raises important concerns about the broader implications of prolonged screen use by administrative staff. Extended screen time can lead to a range of occupational health risks, such as eye strain, headaches, blurred vision, and musculoskeletal problems, including neck and shoulder pain. These issues are compounded by the potential disruption of sleep patterns, as prolonged exposure to screens, especially before bedtime, negatively impacts circadian rhythms, further exacerbating SQ.
Given the prevalence of screen-based work in modern office environments, these health risks are significant for administrative staff who spend long hours on computers. The findings of this study suggest that organizations should consider implementing comprehensive workplace policies to mitigate the negative effects of prolonged screen use. Such policies could include ergonomic interventions, such as adjustable desks, proper lighting, and screen positioning, to reduce physical strain. Additionally, encouraging regular breaks, promoting the use of blue light filters, and educating employees on the importance of sleep hygiene and eye care can significantly improve their overall well-being and productivity.
By adopting these measures, employers can help reduce the incidence of CVS and improve SQ, ultimately fostering a healthier and more productive workforce.
Conclusion
This study indicated that CVS is prevalent among administrative staff at universities. Age, work experience, and use of glasses showed significant differences between individuals affected by CVS and those without the syndrome. Additionally, the SQ of most participants was assessed as unfavorable. The examination of associated risk factors indicated that SQ was unfavorable in men, smokers, individuals without a habit of taking breaks, and those who used screens outside the workplace. The regression analysis results also demonstrated that monitor usage in the workplace increased the likelihood of experiencing CVS symptoms. Specifically, each additional hour of screen usage was associated with 2.52 times increased probability of CVS symptoms. Moreover, increased use of high-quality screens was directly related to poor SQ, although this association was not statistically significant. Considering the long-term impact of screen usage on the occurrence of CVS and sleep disorders, and their influence on individual’s quality of life and performance, it is recommended to implement appropriate safety and health measures to reduce the prevalence of these factors:
Regular breaks: Employees should be encouraged to take short breaks to reduce eye strain and minimize the impact of prolonged screen use. Ergonomic interventions: Provide ergonomic workstations, such as adjustable desks, chairs, and monitor stands, to reduce the physical strain associated with extended screen use. Blue light filters: Implement blue light filters or adjust screen settings to reduce exposure to blue light, which can affect eye health and SQ, especially during evening hours. Education and awareness: Provide training on proper screen usage, posture, and the importance of regular breaks, as well as educate employees about sleep hygiene to improve their overall well-being.
Limitations
This study had several limitations. First, direct ergonomic measurements, such as monitor distance and ambient lighting, were not included, which could have provided a more comprehensive understanding of the factors influencing CVS and SQ. Additionally, the cross-sectional design of this study limits the ability to draw causal inferences, as it only captures a snapshot of the variables at a single point in time, rather than examining changes over a longer period. This study recognizes the limitation of using a questionnaire-based approach, as self-reported data can introduce inherent biases in measuring both CVS and SQ. Participants’ reported screen usage may also be inaccurate, affecting the reliability of the results, and practical tests for measuring vision and SQ, which offer greater precision, were not conducted. In addition, the reported screen usage by participants may contain some inaccuracies.
Suggestions for future research
To improve the objectivity of future studies and minimize these biases, we recommend using objective measures in conjunction with self-reported data. For instance:
Screen time tracking: Objective data on screen usage can be obtained through tracking software or devices that record actual screen time, thus reducing the potential for recall bias and providing more accurate exposure measurements.
Sleep monitors: The use of wearable devices or actigraphy to monitor sleep patterns offers objective data on SQ, duration, and disturbances. These devices provide real-time measurements, which would improve the reliability of SQ assessments compared to self-reported data.
By incorporating these objective measures, future studies could enhance the validity and accuracy of their findings, leading to a clearer understanding of the relationship between screen usage, CVS, and SQ.
Ethical Considerations
Compliance with ethical guidelines
This study was approved by the Ethics Committee of Shahid Beheshti University of Medical Sciences, Tehran, Iran (Code: IR.SBMU.RETECH.REC.1401.868).
Funding
This research did not receive any grant from funding agencies in the public, commercial, or non-profit sectors.
Authors' contributions
All authors contributed equally to the conception and design of the study, data collection and analysis, interception of the results, and manuscript drafting. Each author approved the submission of the final version of the manuscript.
Conflict of interest
The authors declared no conflict of interests.
Acknowledgments
The authors extend their gratitude to the employees of Shahid Beheshti University of Medical Sciences for their coordination during this study
References
- Cantó-Sancho N, Sánchez-Brau M, Ivorra-Soler B, Seguí-Crespo M. Computer vision syndrome prevalence according to individual and video display terminal exposure characteristics in Spanish university students. International Journal of Clinical Practice. 2021; 75(3):e13681. [DOI:10.1111/ijcp.13681] [PMID]
- Zenbaba D, Sahiledengle B, Bonsa M, Tekalegn Y, Azanaw J, Kumar Chattu V. prevalence of computer vision syndrome and associated factors among instructors in Ethiopian Universities: A web-based cross-sectional study. ScientificWorldJournal. 2021; 2021:3384332. [DOI:10.1155/2021/3384332] [PMID]
- Anggrainy P, Lubis RR, Ashar T. The effect of trick intervention 20-20-20 on computer vision syndrome incidence in computer workers. Oftalmologicheskii Zhurnal. 2020; 1(1):22-7. [DOI:10.31288/oftalmolzh202012227]
- Kuss DJ, Griffiths MD. Social networking sites and addiction: Ten lessons learned. International Journal of Environmental Research and Public Health. 2017; 14(3):311. [DOI:10.3390/ijerph14030311] [PMID]
- Stiglic N, Viner RM. Effects of screentime on the health and well-being of children and adolescents: A systematic review of reviews. BMJ Open. 2019; 9(1):e023191. [DOI:10.1136/bmjopen-2018-023191] [PMID]
- Khanwalkar P, Dabir N. Visual ergonomics for changing work environments in the COVID-19 pandemic. Work. 2022; 73(s1):S169-76. [DOI:10.3233/WOR-211130] [PMID]
- Kim H, Kim SJ, Hwang S. Visual display terminal syndrome and its associated factors among university students during the COVID-19 pandemic. Work. 2024; 77(1):23-36. [DOI:10.3233/WOR-220265] [PMID]
- Jalali M, Esmaeili R, Hesam G, Moradpour Z, Farhadi S. Investigating computer vision syndrome and associated factors before and during the COVID-19 pandemic: A comparative cross-sectional study in faculty members. Work. 2025; 80(3):1202-14. [DOI:10.1177/10519815241290055] [PMID]
- Alamri A, Amer KA, Aldosari AA, Althubait BMS, Alqahtani MS, Al Mudawi AAM, et al. Computer vision syndrome: Symptoms, risk factors, and practices. Journal of Family Medicine and Primary Care. 2022; 11(9):5110-5. [DOI:10.4103/jfmpc.jfmpc_1627_21] [PMID]
- Gowrisankaran S, Sheedy JE. Computer vision syndrome: A review. Work. 2015; 52(2):303-14. [DOI:10.3233/WOR-152162] [PMID]
- Akowuah PK, Nti AN, Ankamah-Lomotey S, Frimpong AA, Fummey J, Boadi P, et al. Digital device use, computer vision syndrome, and sleep quality among an African undergraduate population. Advances in Public Health. 2021; 2021(1):6611348. [DOI:10.1155/2021/6611348]
- Kumar BS. A study to evaluate the knowledge regarding computer vision syndrome among medical students. Biomedical & Pharmacology Journal. 2020; 13(1):469-73. [DOI:10.13005/bpj/1907]
- Al Tawil L, Aldokhayel S, Zeitouni L, Qadoumi T, Hussein S, Ahamed SS. Prevalence of self-reported computer vision syndrome symptoms and its associated factors among university students. European Journal of Ophthalmology. 2020; 30(1):189-95. [DOI:10.1177/1120672118815110] [PMID]
- Altalhi A, Khayyat W, Khojah O, Alsalmi M, Almarzouki H. Computer vision syndrome among health sciences students in Saudi Arabia: Prevalence and risk factors. Cureus. 2020; 12(2):e7060. [DOI:10.7759/cureus.7060]
- Mowatt L, Gordon C, Santosh ABR, Jones T. Computer vision syndrome and ergonomic practices among undergraduate university students. International Journal of Clinical Practice. 2018; 72(1). [DOI:10.1111/ijcp.13035] [PMID]
- Wang L, Wei X, Deng Y. Computer vision syndrome during SARS-CoV-2 outbreak in university students: A comparison between online courses and classroom lectures. Frontiers in Public Health. 2021; 9:696036. [DOI:10.3389/fpubh.2021.696036] [PMID]
- Ayaki M, Kawashima M, Negishi K, Tsubota K. High prevalence of sleep and mood disorders in dry eye patients: Survey of 1,000 eye clinic visitors. Neuropsychiatric Disease and Treatment. 2015; 11:889-94. [DOI:10.2147/NDT.S81515] [PMID]
- Fuller C, Lehman E, Hicks S, Novick MB. Bedtime use of technology and associated sleep problems in children. Global Pediatric Health. 2017; 4:2333794X17736972 [DOI:10.1177/2333794X17736972] [PMID]
- Kotrla Topić M, Varga V, Jelovčić S. Digital technology use during the COVID-19 pandemic and its relations to sleep quality and life satisfaction in children and parents. Društvena Istraživanja: Časopis za opća Društvena Pitanja. 2021; 30(2):249-69. [DOI:10.5559/di.30.2.04]
- Watanabe K, Adachi H, Yamamoto R, Fujino R, Ishimaru D, Kanayama D, et al. Increased digital media use is associated with sleep problems among university students: A study during the COVID-19 pandemic in Japan. Frontiers in Psychiatry. 2022; 13:946265. [DOI:10.3389/fpsyt.2022.946265] [PMID]
- Liu H, Liu J, Chen M, Tan X, Zheng T, Kang Z, et al. Sleep problems of healthcare workers in tertiary hospital and influencing factors identified through a multilevel analysis: A cross-sectional study in China. BMJ Open. 2019; 9(12):e032239. [DOI:10.1136/bmjopen-2019-032239] [PMID]
- Singh S, Anderson AJ, Downie LE. Insights into Australian optometrists' knowledge and attitude towards prescribing blue light-blocking ophthalmic devices. Ophthalmic & Physiological Optics. 2019; 39(3):194-204. [DOI:10.1111/opo.12615] [PMID]
- Lurati AR. Computer Vision Syndrome: Implications for the occupational health nurse. Workplace Health & Safety. 2018; 66(2):56-60. [DOI:10.1177/2165079917731790] [PMID]
- Stringham JM, Stringham NT, O'Brien KJ. Macular carotenoid supplementation improves visual performance, sleep quality, and adverse physical symptoms in those with high screen time exposure. Foods. 2017; 6(7):47. [DOI:10.3390/foods6070047] [PMID]
- Nielsen. The Nielsen Total Audience Report: Q1 2016. New York: Nielsen Company; 2016. [Link]
- The Vision Council. 2015 digital eye strain report. Alexandria: The Vision Council; 2015. [Link]
- Chen J, Liang Y, Mai C, Zhong X, Qu C. General deficit in inhibitory control of excessive smartphone users: Evidence from an event-related potential study. Frontiers in Psychology. 2016; 7:511. [DOI:10.3389/fpsyg.2016.00511]
- Porcar E, Pons AM, Lorente A. Visual and ocular effects from the use of flat-panel displays. International Journal of Ophthalmology. 2016; 9(6):881-5. [PMID]
- Patil A, Bhavya, Chaudhury S, Srivastava S. Eyeing computer vision syndrome: Awareness, knowledge, and its impact on sleep quality among medical students. Industrial Psychiatry Journal. 2019; 28(1):68-74. [DOI:10.4103/ipj.ipj_93_18] [PMID]
- Noreen K, Ali K, Aftab K, Umar M. Computer vision syndrome (CVS) and its associated risk factors among undergraduate medical students in midst of COVID-19. Pakistan Journal of Ophthalmology. 2021; 37(1). [Link]
- Wangsan K, Upaphong P, Assavanopakun P, Sapbamrer R, Sirikul W, Kitro A, et al. Self-Reported computer vision syndrome among Thai University students in virtual classrooms during the covid-19 pandemic: Prevalence and associated factors. International Journal of Environmental Research and Public Health. 2022; 19(7):3996. [DOI:10.3390/ijerph19073996] [PMID]
- QoLami M, Cantó Sancho N, Seguí-Crespo M, Ronda-Pérez E, Mirzajani A, Taghizade G. Prevalence of computer vision syndrome among Iranian Medical University employees and graduate students in their occupational environment. Function and Disability Journal. 2020; 3(1):151-60. [Link]
- Akbari Kamrani AA, Shams A, Shamsipour Dehkordi P, Mohajeri R. The effect of low and moderate intensity aerobic exercises on sleep quality in men older adults. Pakistan Journal of Medical Sciences. 2014; 30(2):417-21. [DOI:10.12669/pjms.302.4386] [PMID]
- Farrahi Moghaddam J, Nakhaee N, Sheibani V, Garrusi B, Amirkafi A. Reliability and validity of the Persian version of the Pittsburgh Sleep Quality Index (PSQI-P). Sleep & Breathing. 2012; 16(1):79-82. [DOI:10.1007/s11325-010-0478-5] [PMID]
- QoLami M, Mirzajani A, Ronda-Pérez E, Cantó-Sancho N, Seguí-Crespo M. Translation, cross-cultural adaptation and validation of the Computer Vision Syndrome Questionnaire into Persian (CVS-Q FA©). IInternational Ophthalmology. 2022; 42(11):3407-20. [DOI:10.1007/s10792-022-02340-3] [PMID]
- Sigman A. Time for a view on screen time. Archives of Disease in Childhood. 2012; 97(11):935-42. [DOI:10.1136/archdischild-2012-302196] [PMID]
- Derbew H, Nega A, Tefera W, Zafu T, Tsehaye K, Haile K, et al. Assessment of computer vision syndrome and personal risk factors among employees of commercial bank of ethiopia in Addis Ababa, Ethiopia. Journal of Environmental and Public Health. 2021; 2021:6636907. [DOI:10.1155/2021/6636907] [PMID]
- Lemma MG, Beyene KG, Tiruneh MA. Computer Vision Syndrome and associated factors among Secretaries Working in Ministry Offices in Addis Ababa, Ethiopia. Clinical Optometry. 2020; 12:213-22. [DOI:10.2147/OPTO.S284934] [PMID]
- Tesfaye AH, Alemayehu M, Abere G, Mekonnen TH. Prevalence and associated factors of computer vision syndrome among academic staff in the University of Gondar, Northwest Ethiopia: An institution-based cross-sectional study. Environmental Health Insights. 2022; 16:11786302221111865.[DOI:10.1177/11786302221111865] [PMID]
- Ranasinghe P, Wathurapatha WS, Perera YS, Lamabadusuriya DA, Kulatunga S, Jayawardana N, et al. Computer vision syndrome among computer office workers in a developing country: an evaluation of prevalence and risk factors. BMC Research Notes. 2016; 9:150. [DOI:10.1186/s13104-016-1962-1] [PMID]
- Boadi-Kusi SB, Abu SL, Acheampong GO, Adueming PO, Abu EK. Association between Poor Ergophthalmologic Practices and Computer Vision Syndrome among University Administrative Staff in Ghana. Journal of Environmental and Public Health. 2020; 2020:7516357. [DOI:10.1155/2020/7516357] [PMID]
- Zayed HAM, Saied SM, Younis EA, Atlam SA. Digital eye strain: Prevalence and associated factors among information technology professionals, Egypt. Environmental Science and Pollution Research. 2021; 28(20):25187-95. [DOI:10.1007/s11356-021-12454-3] [PMID]
- Lindo-Cano EF, García-Monge VA, Castillo-Cadillo KJ, Sánchez-Tirado EA, Távara IM, Morales J. Computer-digital vision syndrome among university students of Lima City. The Open Public Health Journal. 2022; 15(1). [DOI:10.2174/18749445-v15-e2208104]
- Abudawood GA, Ashi HM, Almarzouki NK. Computer vision syndrome among undergraduate medical students in King Abdulaziz University, Jeddah, Saudi Arabia. Journal of Ophthalmology. 2020; (1):2789376. [Link]
- Das A, Shah S, Adhikari TB, Paudel BS, Sah SK, Das RK, et al. Computer vision syndrome, musculoskeletal, and stress-related problems among visual display terminal users in Nepal. PLoS One. 2022; 17(7):e0268356. [DOI:10.1371/journal.pone.0268356] [PMID]
- Mashige KP, Rampersad N, Oduntan OA. A study of ergonomic factors leading to computer vision syndrome among computer users. Ergonomics SA. 2013; 25(1):3-12. [Link]
- Karmacharya S, Singh P, Rizyal A, Shrestha RK. Digital eye strain among undergraduate medical students of Nepal Medical College and Teaching Hospital during COVID-19 pandemic. Nepal Medical College Journal. 2022; 24(4):352-62. [Link]
- Asakawa K, Kanno S, Ando T, Osawa K, Ishikawa H. The effects of chewing gum in preventing eyestrain. BioMed Research International. 2020; 2020:2470473. [DOI:10.1155/2020/2470473] [PMID]
- Turgut B. Ocular ergonomics for the computer vision syndrome. Journal of Eye and Vision. 2018; 1(1):2. [Link]
- Coronel-Ocampos J, Gómez J, Gómez A, Quiroga-Castañeda PP, Valladares-Garrido MJ. Computer Visual Syndrome in Medical Students From a Private University in Paraguay: A survey study. Frontiers in Public Health. 2022; 10:935405. [DOI:10.3389/fpubh.2022.935405] [PMID]
- Assefa NL, Weldemichael DZ, Alemu HW, Anbesse DH. Prevalence and associated factors of computer vision syndrome among bank workers in Gondar City, northwest Ethiopia, 2015. Clinical Optometry. 2017; 9:67-76. [DOI:10.2147/OPTO.S126366] [PMID]
- Tsou MT. Influence of prolonged visual display terminal use on physical and mental conditions among health care workers at Tertiary Hospitals, Taiwan. International Journal of Environmental Research and Public Health. 2022; 19(7):3770. [DOI:10.3390/ijerph19073770] [PMID]
- Papas EB. The global prevalence of dry eye disease: A Bayesian view. Ophthalmic & Physiological Optics. 2021; 41(6):1254-66. [DOI:10.1111/opo.12888] [PMID]
- Teeling JL, Asuni AA. Immune to brain communication in health, age and disease: Implications for understanding age-related neurodegeneration. In: Bueno V, Lord J, Jackson T, editors. The Ageing Immune System and Health. Cham: Springer; 2017. [DOI:10.1007/978-3-319-43365-3_8]
- de Paiva CS. Effects of aging in dry eye. International Ophthalmology Clinics. 2017; 57(2):47-64. [DOI:10.1097/IIO.0000000000000170] [PMID]
- Tika RM, Fitria L. Risk factors of computer vision syndrome in students during online learning period. International Journal of Public Health Science. 2023; 12(2):875-81. [Link]
- Huyhua-Gutierrez SC, Zeladita-Huaman JA, Díaz-Manchay RJ, Dominguez-Palacios AB, Zegarra-Chapoñan R, Rivas-Souza MA, et al. Digital eye strain among peruvian nursing students: Prevalence and associated factors. International Journal of Environmental Research and Public Health. 2023; 20(6):5067. [DOI:10.3390/ijerph20065067] [PMID]
- Dessie A, Adane F, Nega A, Wami SD, Chercos DH. Computer vision syndrome and associated factors among computer users in Debre Tabor Town, Northwest Ethiopia. Journal of Environmental and Public Health. 2018; 2018:4107590. [DOI:10.1155/2018/4107590] [PMID]
- Akinbinu TR, Mashalla Y. Knowledge of computer vision syndrome among computer users in the workplace in Abuja, Nigeria. Journal of Physiology and Pathophysiology. 2013; 4(4):58-63. [DOI:10.5897/JPAP2013.0078]
- Almojali AI, Almalki SA, Alothman AS, Masuadi EM, Alaqeel MK. The prevalence and association of stress with sleep quality among medical students. Journal of Epidemiology and Global Health. 2017; 7(3):169-74. [DOI:10.1016/j.jegh.2017.04.005] [PMID]
- Windiani IGAT, Noviyani NMR, Adnyana IGANS, Murti NLSP, Soetjiningsih S. Prevalence of sleep disorders in adolescents and its relation with screen time during the COVID-19 pandemic era. Open Access Macedonian Journal of Medical Sciences. 2021; 9(B):297-300. [DOI:10.3889/oamjms.2021.5974]
- Gamble AL, D'Rozario AL, Bartlett DJ, Williams S, Bin YS, Grunstein RR, et al. Adolescent sleep patterns and night-time technology use: Results of the Australian Broadcasting Corporation's Big Sleep Survey. PLoS One. 2014; 9(11):e111700. [DOI:10.1371/journal.pone.0111700] [PMID]
- Pham HT, Chuang HL, Kuo CP, Yeh TP, Liao WC. Electronic device use before bedtime and sleep quality among university students. Healthcare (Basel). 2021; 9(9):1091. [DOI:10.3390/healthcare9091091] [PMID]
- Yang Y, Zhu JF, Yang SY, Lin HJ, Chen Y, Zhao Q, et al. Prevalence and associated factors of poor sleep quality among Chinese returning workers during the COVID-19 pandemic. Sleep Medicine. 2020; 73:47-52. [DOI:10.1016/j.sleep.2020.06.034] [PMID]
- Siddiqui AF, Al-Musa H, Al-Amri H, Al-Qahtani A, Al-Shahrani M, Al-Qahtani M. Sleep patterns and predictors of poor sleep quality among medical students in King Khalid University, Saudi Arabia. The Malaysian Journal of Medical Sciences. 2016; 23(6):94-102. [DOI:10.21315/mjms2016.23.6.10] [PMID]
- Yazdi Z, Loukzadeh Z, Moghaddam P, Jalilolghadr S. Sleep hygiene practices and their relation to sleep quality in Medical Students of Qazvin University of Medical Sciences. Journal of Caring Sciences. 2016; 5(2):153-60. [DOI:10.15171/jcs.2016.016] [PMID]
- Kumar VA, Chandrasekaran V, Brahadeeswari H. Prevalence of smartphone addiction and its effects on sleep quality: A cross-sectional study among medical students. Industrial Psychiatry Journal. 2019; 28(1):82-85. [DOI:10.4103/ipj.ipj_56_19] [PMID]
- Madrid-Valero JJ, Martínez-Selva JM, Ribeiro do Couto B, Sánchez-Romera JF, Ordoñana JR. Age and gender effects on the prevalence of poor sleep quality in the adult population. Gaceta Sanitaria. 2017; 31(1):18-22. [DOI:10.1016/j.gaceta.2016.05.013] [PMID]
- Lu L, Wang SB, Rao W, Zhang Q, Ungvari GS, Ng CH, et al. The prevalence of sleep disturbances and sleep quality in older chinese adults: A comprehensive meta-analysis. Behavioral Sleep Medicine. 2019; 17(6):683-97. [DOI:10.1080/15402002.2018.1469492] [PMID]
- Janatmakan Amiri A, Morovatdar N, Soltanifar A, Rezaee R. Prevalence of sleep disturbance and potential associated factors among medical students from Mashhad, Iran. Sleep Disorders. 2020; 2020:4603830. [DOI:10.1155/2020/4603830] [PMID]
- Savarimuthu JR, Subramanian K. Associations between digital amnesia, sleep disorders and somatic symptoms among youth. Cognition, Brain, Behavior. 2022; 26(2):121-35.[DOI:10.24193/cbb.2022.26.07]
- Wilson M, Riedy SM, Himmel M, English A, Burton J, Albritton S, et al. “Sleep quality, sleepiness and the influence of workplace breaks: A cross-sectional survey of health-care workers in two US hospitals. Chronobiology International. 2018; 35(6):849-52. [DOI:10.1080/07420528.2018.1466791] [PMID]
- Purani H, Friedrichsen S, Allen AM. Sleep quality in cigarette smokers: Associations with smoking-related outcomes and exercise. Addictive Behaviors. 2019; 90:71-6. [DOI:10.1016/j.addbeh.2018.10.023] [PMID]
- Aljerian K, Alamri R, Althomali A, Aljamili L, Alkhalaf L, Alsultan Z, et al. Prevalence of substance use among students in health colleges in Saudi Arabia: A cross-sectional study. Cureus. 2024; 16(10):e70890. [DOI:10.7759/cureus.70890]
- Chiu NT, Lee BF, Yeh TL, Chen PS, Lee IH, Chen KC, et al. Relationship between striatal dopamine transporter availability and sleep quality in healthy adults. Molecular Imaging and Biology. 2011; 13(6):1267-71. [DOI:10.1007/s11307-010-0442-6] [PMID]
- Chung SJ, Yoo HS, Oh JS, Kim JS, Ye BS, Sohn YH, et al. Effect of striatal dopamine depletion on cognition in de novo Parkinson's disease. Parkinsonism & Related Disorders. 2018; 51:43-48. [DOI:10.1016/j.parkreldis.2018.02.048] [PMID]
- Wiers CE, Cabrera EA, Tomasi D, Wong CT, Demiral ŞB, Kim SW, et al. Striatal dopamine D2/D3 receptor availability varies across smoking status.Neuropsychopharmacology. 2017; 42(12):2325-32. [DOI:10.1038/npp.2017.131] [PMID]
Type of Study: Research |
Subject:
Sport injury and corrective exercises
Received: 2024/07/31 | Accepted: 2025/01/6 | Published: 2025/10/18
Received: 2024/07/31 | Accepted: 2025/01/6 | Published: 2025/10/18
Send email to the article author
| Rights and permissions | |
 |
This work is licensed under a Creative Commons Attribution-NonCommercial 4.0 International License. |
This is an open access article distributed under the terms of the Creative Commons Attribution-NonCommercial 4.0 (CC-By-NC 4.0), which permits use, distribution, and reproduction in any medium, provided the original work is properly cited and is not used for commercial purposes.
Contact Information