Thu, Jun 11, 2026
Volume 15, Issue 2 (Spring 2025)
PTJ 2025, 15(2): 151-164 |
Back to browse issues page


Download citation:
BibTeX | RIS | EndNote | Medlars | ProCite | Reference Manager | RefWorks
Send citation to:


BibTeX | RIS | EndNote | Medlars | ProCite | Reference Manager | RefWorks
Send citation to:
Ebrahimi A, Jafarpishe A S, Vahedi M, Izadi Laybidi M, Mohammadi S. Comparison of the Effectiveness of Gamification, Tracking Patterns, and Visual Gauges in Improving Hand Motor Performance Through Biofeedback. PTJ 2025; 15 (2) :151-164
URL: http://ptj.uswr.ac.ir/article-1-662-en.html
URL: http://ptj.uswr.ac.ir/article-1-662-en.html
Ayda Ebrahimi1 

 , Amir Salar Jafarpishe *2 , Mohsen Vahedi3 , Marzieh Izadi Laybidi4 , Somayeh Mohammadi5
, Amir Salar Jafarpishe *2 , Mohsen Vahedi3 , Marzieh Izadi Laybidi4 , Somayeh Mohammadi5
1- Department of Ergonomics, Faculty of Rehabilitation, University of Social Welfare and Rehabilitation Sciences, Tehran, Iran.
2- Department of Ergonomics, Faculty of Rehabilitation, University of Social Welfare and Rehabilitation Sciences, Tehran, Iran. & Neuromusculoskeletal Rehabilitation Research Center, University of Social Welfare and Rehabilitation Sciences, Tehran, Iran.
3- Substance Abuse and Dependence Research Center, University of Social Welfare and Rehabilitation Sciences, Tehran, Iran. & Department of Biostatistics and Epidemiology, Faculty of Social Health, University of Social Welfare and Rehabilitation Sciences, Tehran, Iran.
4- Department of Ergonomics, School of Public Health, Iran University of Medical Sciences, Tehran, Iran.
5- Department of Physiotherapy, Faculty of Rehabilitation, University of Social Welfare and Rehabilitation Sciences, Tehran, Iran.
Full-Text [PDF 2527 kb]
(642 Downloads)
| Abstract (HTML) (2799 Views)
Full-Text: (498 Views)
Introduction
The scientific method for evaluating and estimating muscle activity involves recording, measuring, and analyzing the biological signals produced during muscle contraction. This method is based on the use of equipment that allows for the comparison of the type of activity and amount of muscle work with the changes in the indicators of the signals. Importantly, any body movement and physical activity under different conditions is caused by the activity and contraction of muscles related to that movement [1, 2]. One of the techniques commonly utilized is biofeedback. Biofeedback is a process that involves monitoring and providing biological data to an individual and has been rooted in the field of physiological psychology since the 1960s [3, 4]. Biofeedback is a straightforward and efficient approach that can be applied to many individuals to enhance neuromuscular function. This technique involves attaching electrical sensors to the individual, which measure and process information related to the body’s nerves, muscles, and autonomous activities. The sensors then provide audio or video feedback to the individual and the therapist. Biofeedback’s primary objective is to understand voluntary actions through audio or visual means and enable individuals to consciously alter their physiological actions to achieve optimal health [5]. Biofeedback involves instrumentation to provide an individual with real-time information about a specific physiological process regulated by the autonomic nervous system that is not fully understood. During biofeedback training, the individual actively works toward restoring health and may passively accept instructions to a greater or lesser extent [1].
In rehabilitation, the incorporation of games are embraced due to their persuasive and motivational capabilities and their capacity to establish reward systems. Although these elements are regarded as significant contributors to the therapeutic outcomes of interventions, it is essential to recognize that they do not guarantee the desired therapeutic results. Despite this limitation, using games for rehabilitation has remained a vital component. One notable aspect of these games is their reward system, which engages the neural system to facilitate long-term learning—something that cannot be easily disregarded [6]. The concept of gamification involves incorporating game design elements into nongame contexts. Numerous studies have demonstrated its effectiveness in boosting motivation and engagement in various fields, including education. Research has shown that gamification can enhance learning experiences by fostering a more committed and motivated mindset among learners [7, 8]. Conventional and interactive games, which utilize gaming software, are designed to increase motivation for exercise performance in biofeedback [9].
Pattern tracking in biofeedback refers to monitoring and analyzing the patterns of physiological responses, such as brainwaves, muscle tone, skin conductance, heart rate, and pain perception, to gain greater awareness and control over these functions [10, 11]. One key study on pattern tracking in biofeedback is the biofeedback training for pattern recognition study, which found that participants who used the pattern similarity biofeedback system showed a significant improvement in their classification score for the retrained gesture [10].
Visual gauge biofeedback is a method of biofeedback therapy that utilizes visual cues to provide individuals with information about their physiological responses, such as muscle activity [12]. Visual gauge biofeedback is useful in treatment, mainly motor function and gait rehabilitation. Various studies have demonstrated its effectiveness, and it is a valuable resource for individuals and therapists alike [13].
Motor skills and motor learning are essential components of hand biofeedback, a technique that improves motor control and performance in individuals with various motor disorders [14]. Motor skills are acquired through repeated practice to control the movements of joints and body parts voluntarily. Scientists call this process motor learning, control, or skill acquisition. Studying motor learning and control is crucial for enhancing performance and promoting rehabilitation. The upper limb’s movement function includes grasping and extending toward objects and maintaining a hold on them [15]. Individuals with information about their muscle activity have been shown to modestly improve motor control compared to the ones with impaired hands [16]. A study was conducted in an electronic parts manufacturing factory to examine the effectiveness of the two interventions in reducing muscle tension in the hand area. The first group received muscle learning therapy, whereas the second group utilized adult learning methods and cognitive behavioral techniques to enhance their ability to manage muscle tension symptoms in the hand area, stress, and problem-solving. The workers were randomly divided into the control and intervention groups. Baseline data were collected before training via symptom notes and electromyography recordings of the trapezius and forearm muscles of the left and right arms. After 6 weeks, significant differences were observed between the control and intervention groups. The control group presented increased muscle tension, the second group demonstrated a significant decrease, and the first group presented little change. These disparities were not sustained in the subsequent evaluations. The first group continuously increased their capacity to reduce muscle tension in the trapezius region after 6 and 32 weeks and demonstrated some efficacy for the forearm [17].
Motor learning and motor performance are two distinct concepts that are related but not interchangeable. Motor learning is about acquiring the ability to produce skilled actions through practice and experience, resulting in a relatively permanent change. On the other hand, motor performance is about executing a motor skill; various factors and results can influence a temporary, non-permanent change [18].
Studies on hand motor performance are necessary to deepen our understanding of the complex interactions between cognitive processes, neural control, and physical movements involved in hand function. These studies aim to uncover the underlying mechanisms influencing hand performance and the factors contributing to individual differences in hand function. Research in this area seeks to improve motor skills and performance, which are crucial for everyday activities, work, and overall quality of life. By investigating the effects of various factors, such as handedness, sex, and motor practice, on hand motor performance, scientists can develop more effective training methods and interventions to enhance motor skills [19]. Research on hand motor performance contributes to understanding the intricate relationships between brain function, cognitive processes, and physical movements. By exploring the neural mechanisms underlying hand motor control, scientists can advance our knowledge of brain-body interactions and develop more effective interventions for motor disorders [20].
Materials and Methods
At the outset, the research plan was shared with individuals who expressed interest and were willing to participate. Informed consent was obtained from all the participants. To ensure the validity and reliability of the study, the following inclusion and exclusion criteria were established.
Inclusion criteria
Participants must be between 18 and 35 years old. They must be currently studying and not have any known balance-related problems or conditions (e.g vertigo, inner ear disorders, etc.). Also, they must not have any known hand-related issues or conditions (e.g arthritis, carpal tunnel syndrome, etc.).
Exclusion criteria
Participants who did not wish to participate in the study, experienced pain or discomfort during the study, and became tired or fatigued during the study were excluded. These criteria were established to ensure that the study population is representative of the target population and to minimize any potential biases or confounding variables.
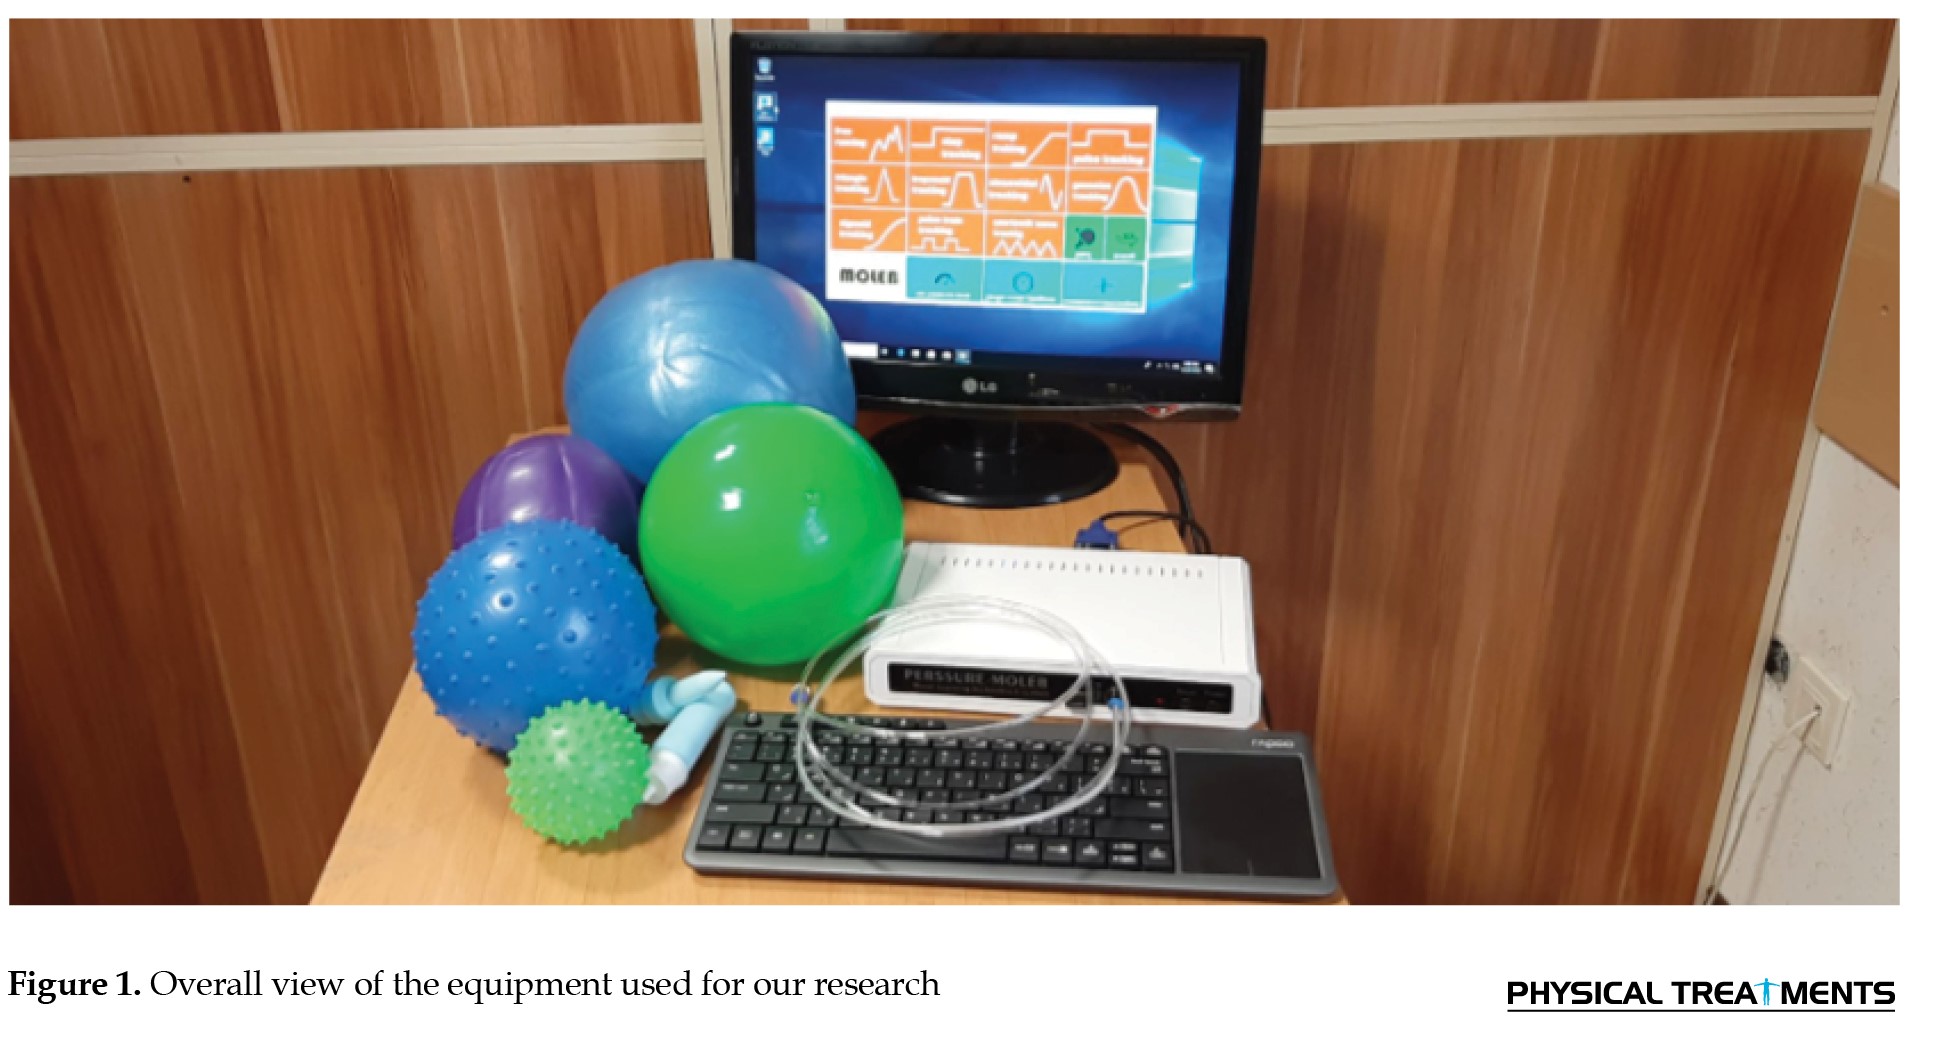
Sixty individuals were randomly assigned to one of four groups. The device was then connected to a display system, and a suitable cuff was attached. The experiment utilized a Pressure Biofeedback MOLEB device to collect data on participants’ pressure responses (Figure 1).
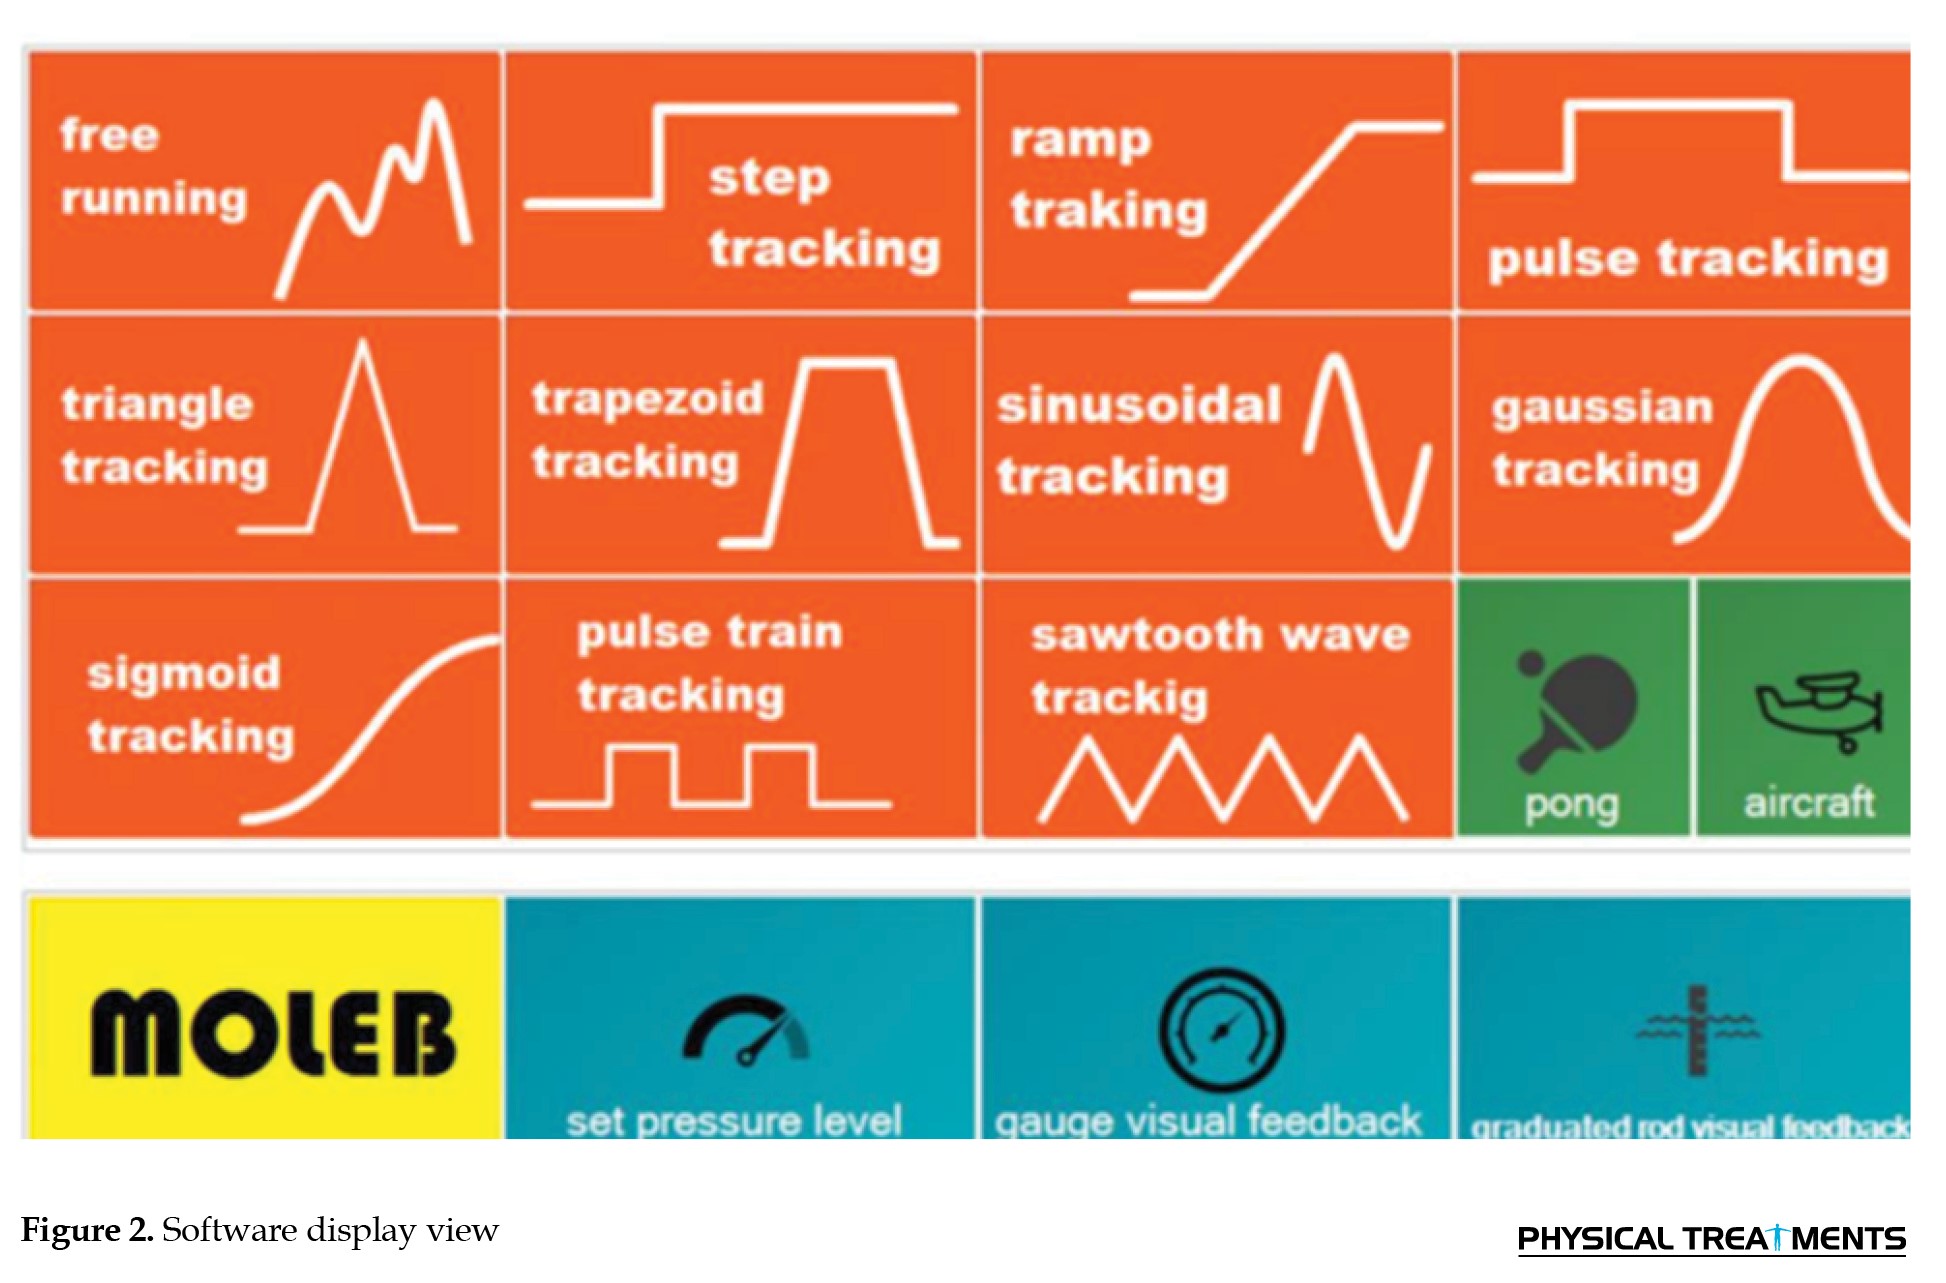
 First, as depicted in the Figure 2, the individual’s initial maximum power was measured in the “gauge visual feedback” section.
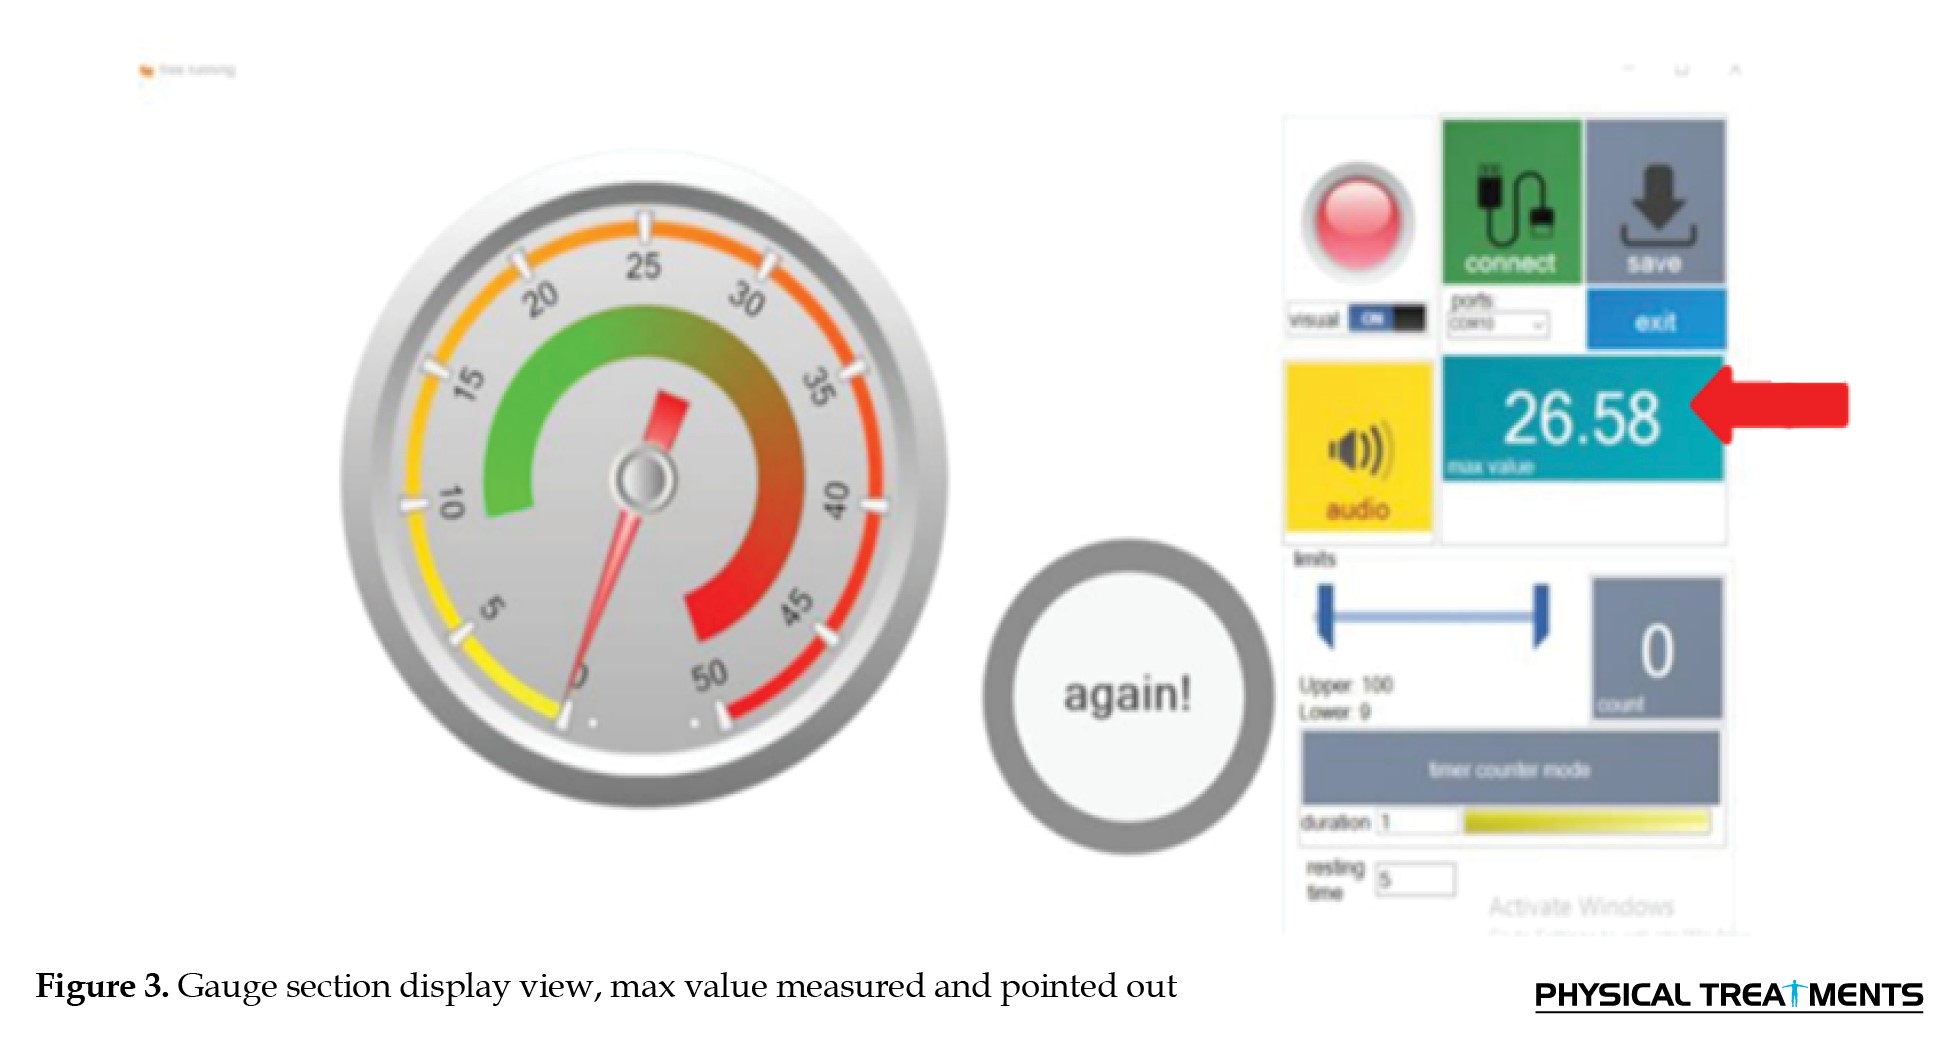
 The participant was requested to exert the greatest possible amount of force, and this pressure level was documented as the maximum voluntary contraction (MVC) force. To account for individual variations, the participants were instructed to carry out the task once; the obtained value was multiplied by 70% and established as the anticipated value that the individual was expected to attain, and the device was correspondingly adjusted. We considered the maximum voluntary contraction force for each participant.
We established the base value (lower limit) as 6 and the upper limit as 70% of the individual’s MVC strength (Figure 3).
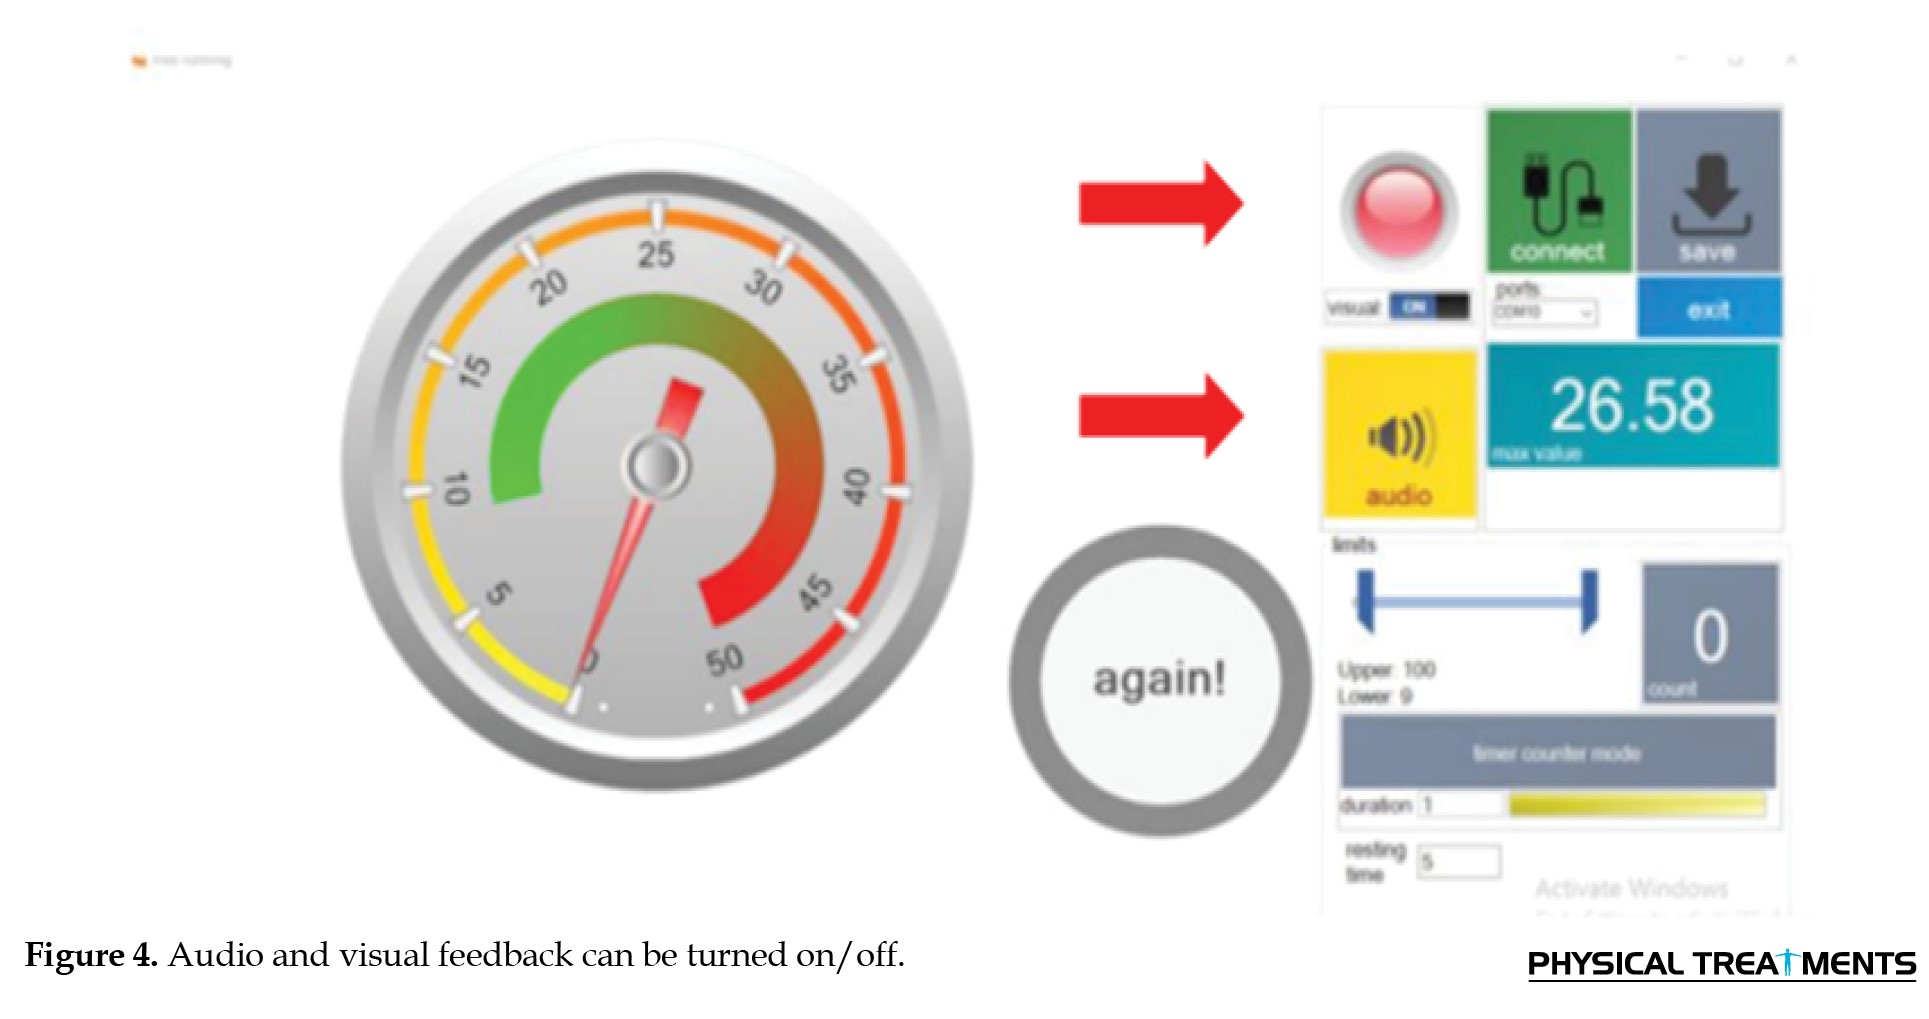
 The intervention involved using a chair equipped with an armrest, with the subject’s hand on it. The participant was instructed to press the cuff multiple times, and explanations were provided without the device capturing any data. To guarantee that the individuals received accurate feedback on their performance, two forms of feedback—visual and auditory—were incorporated, as depicted in the Figure 4.
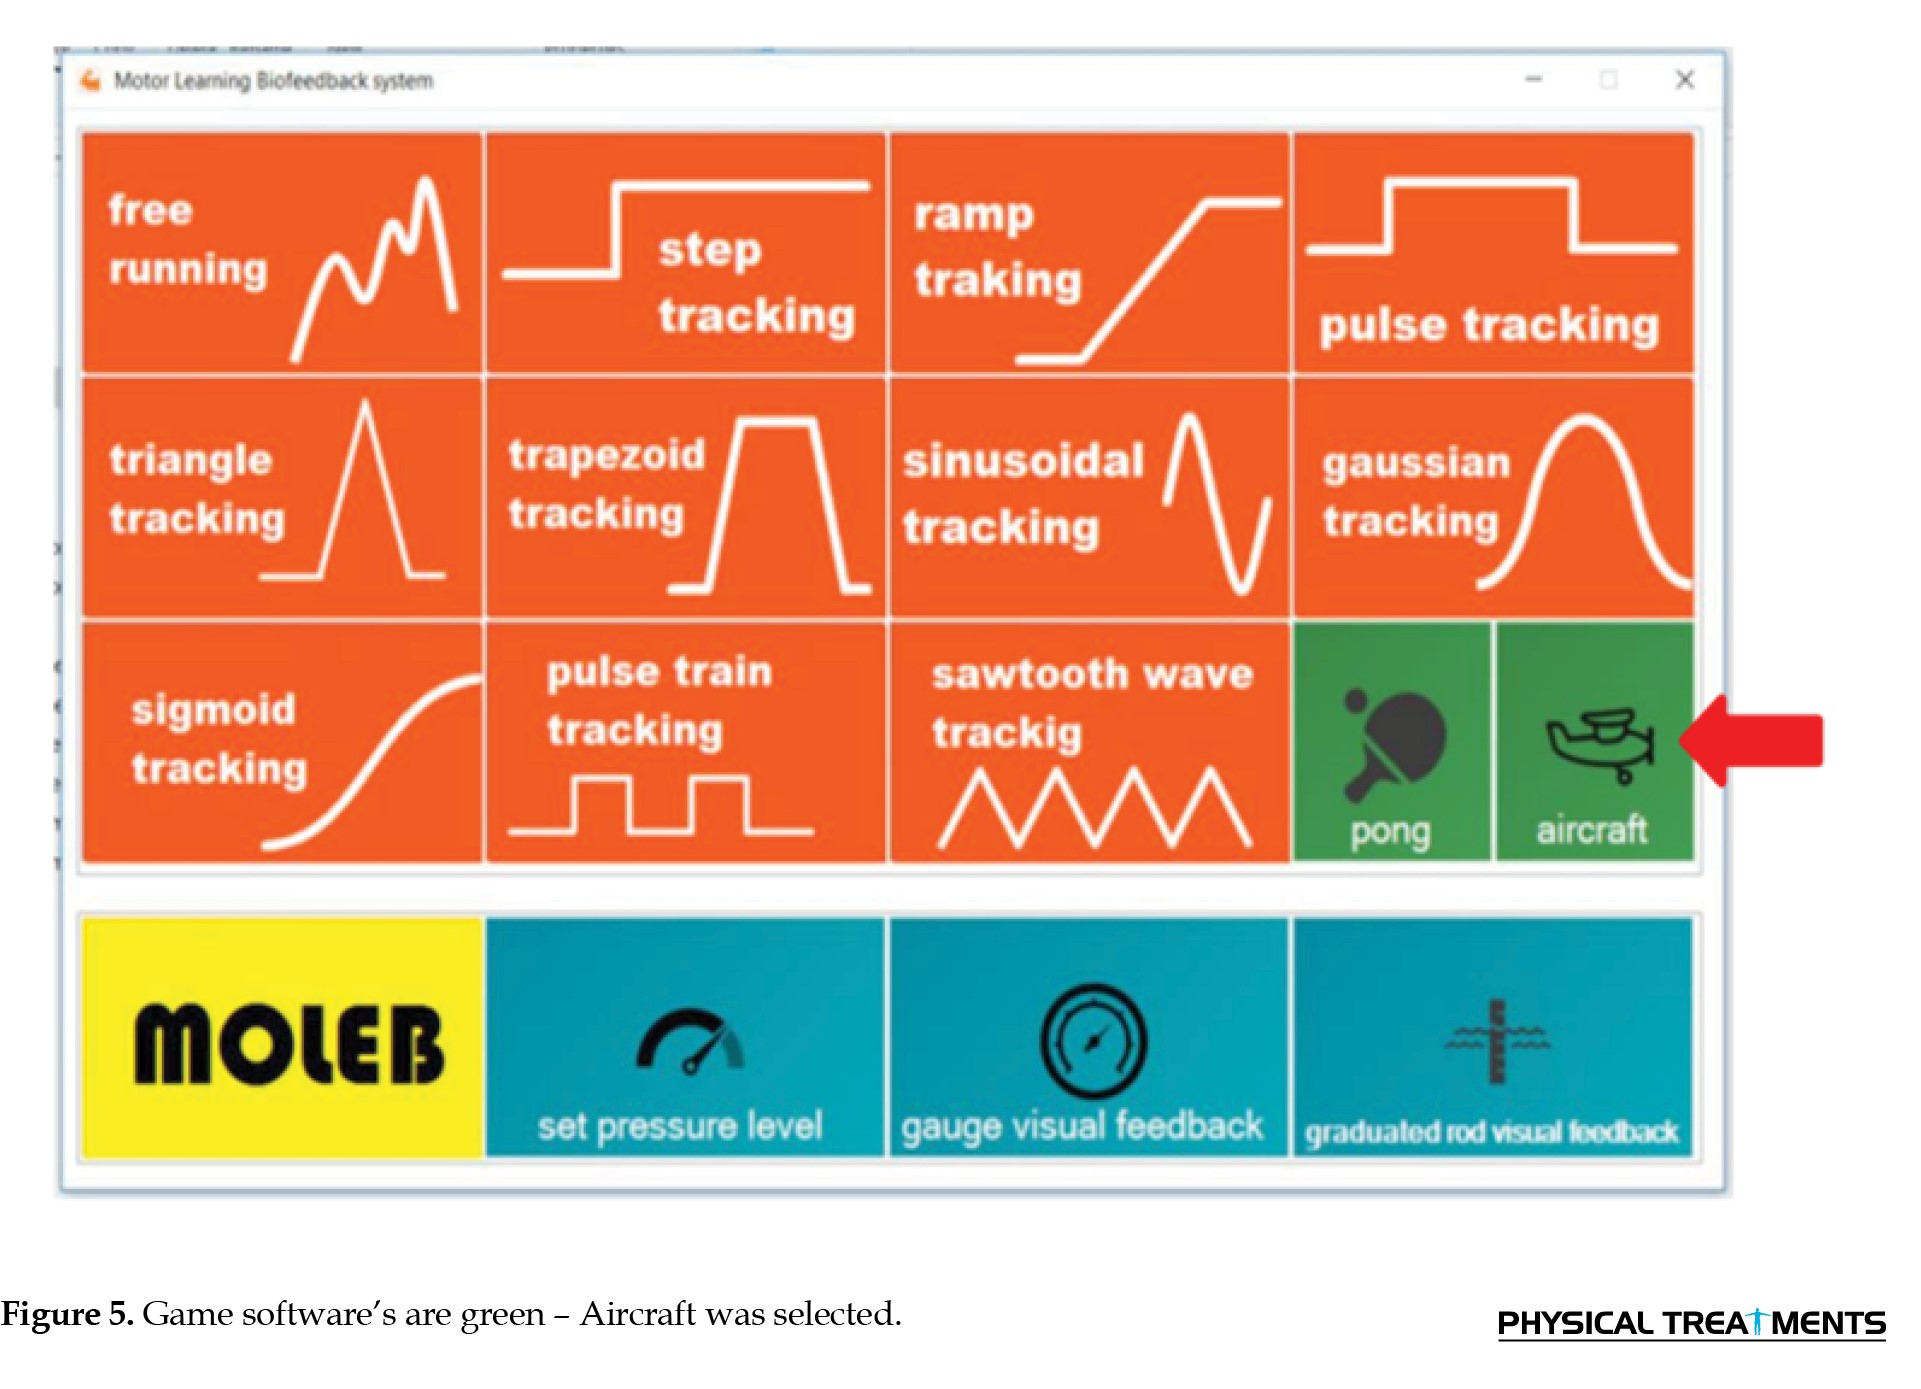
 The data for each individual were documented. As our preassessment method, we asked all participants to use pattern-tracking software on the device. One of the pattern-following software programs of the device, known as the sinusoidal pattern, was subsequently selected.
The first group was chosen to participate in the Aircraft game (Figure 5).
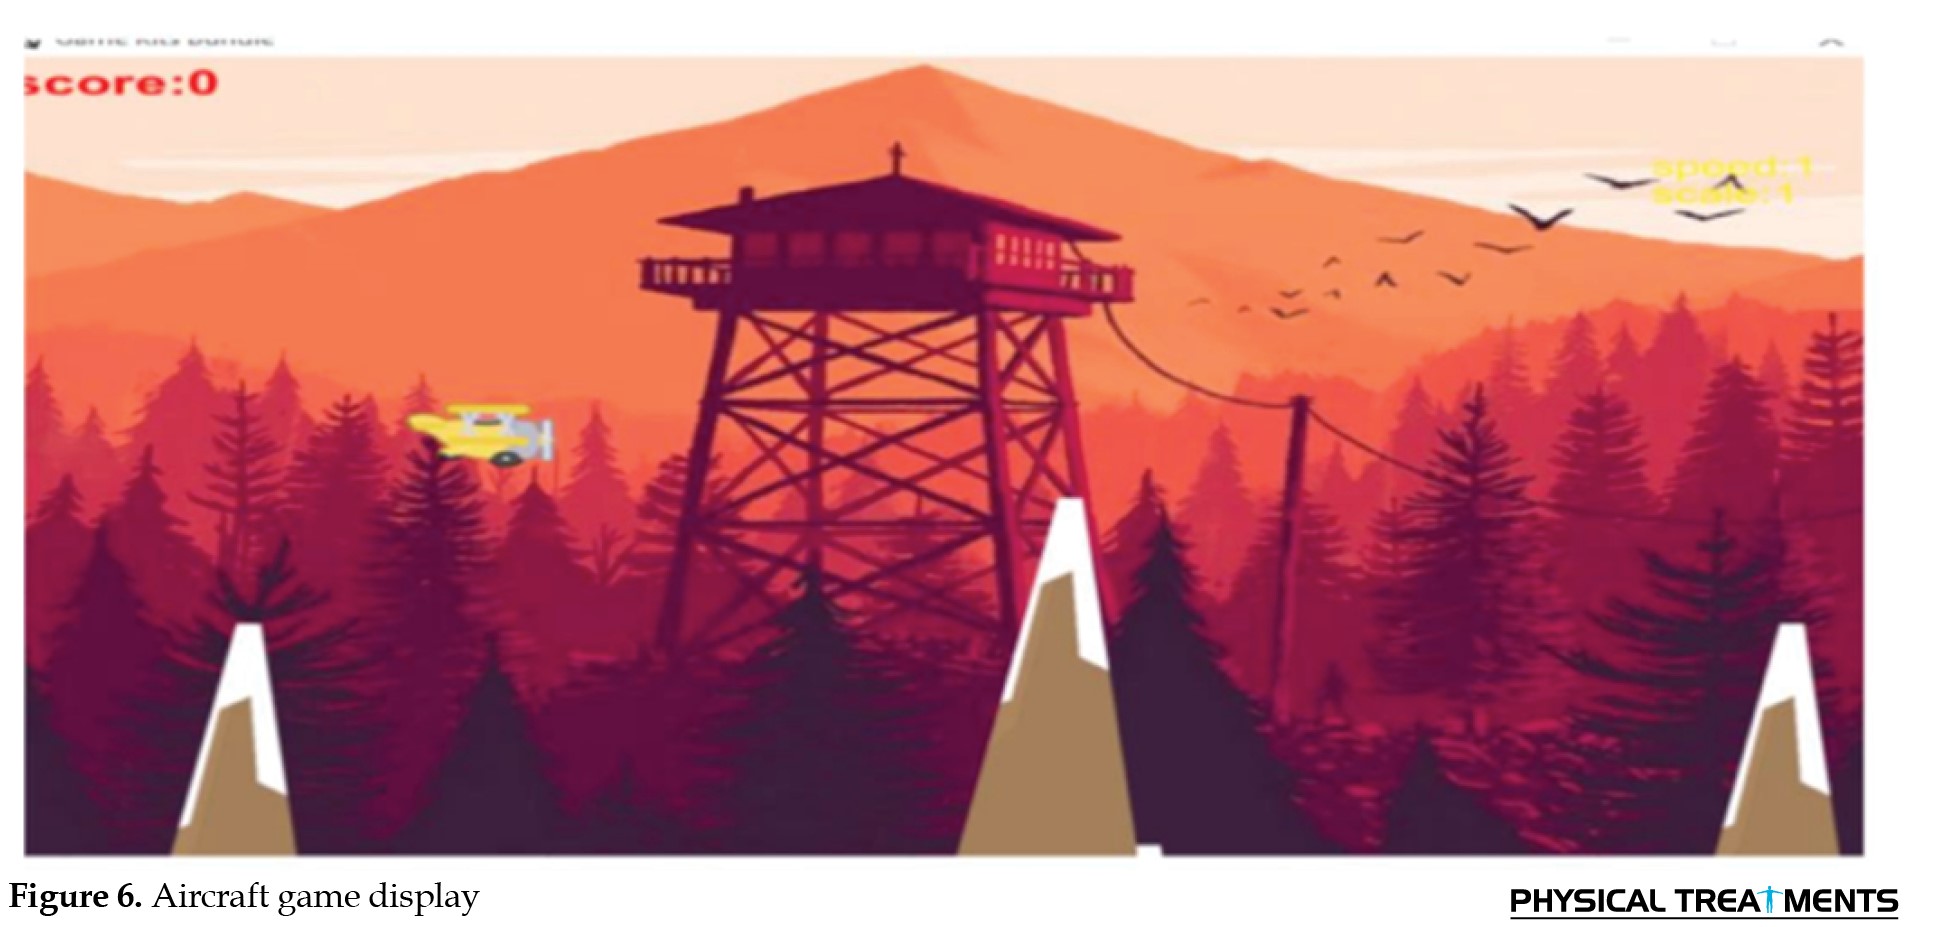
 The participants were instructed to manipulate the hand pressure on the cuff to maneuver the plane through rocky terrain. The objective was to maintain a continuous flight without crashing for as long as possible, with the duration measured in time. This task was scheduled for 15 min, divided into four intervals of gameplay (2.5 min), followed by a 30-second break (Figure 6).
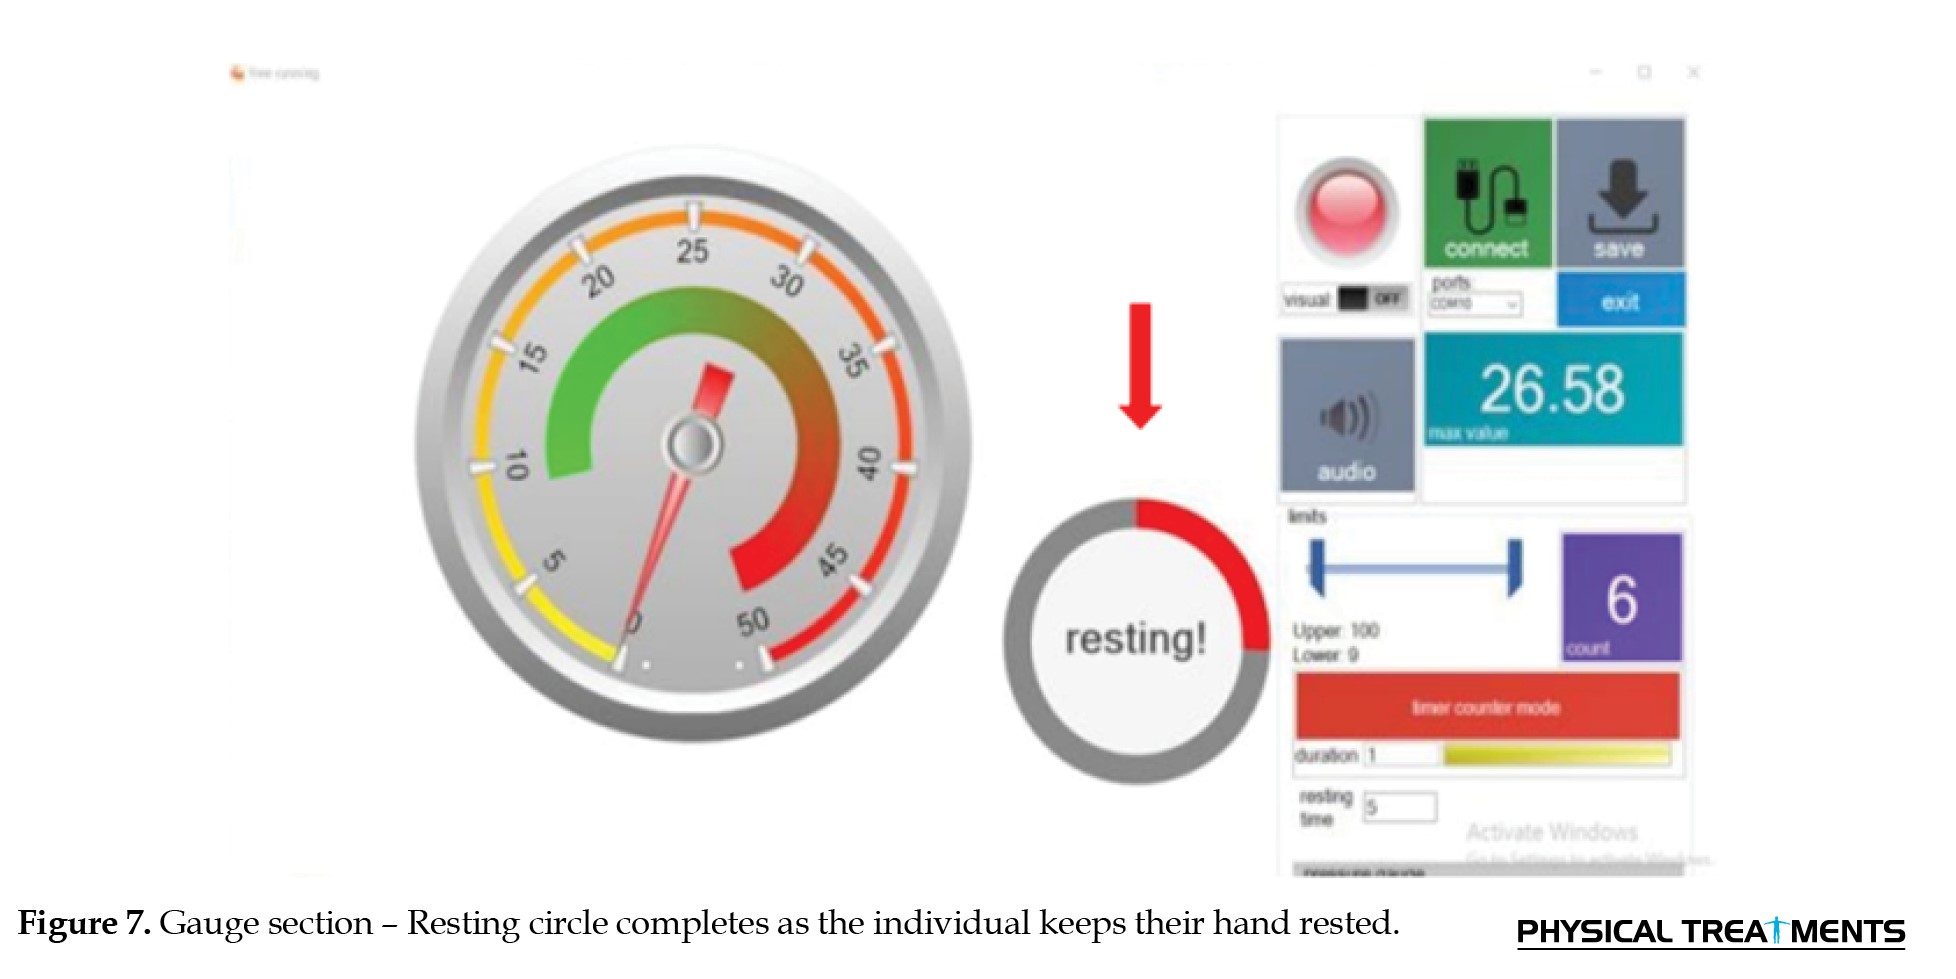
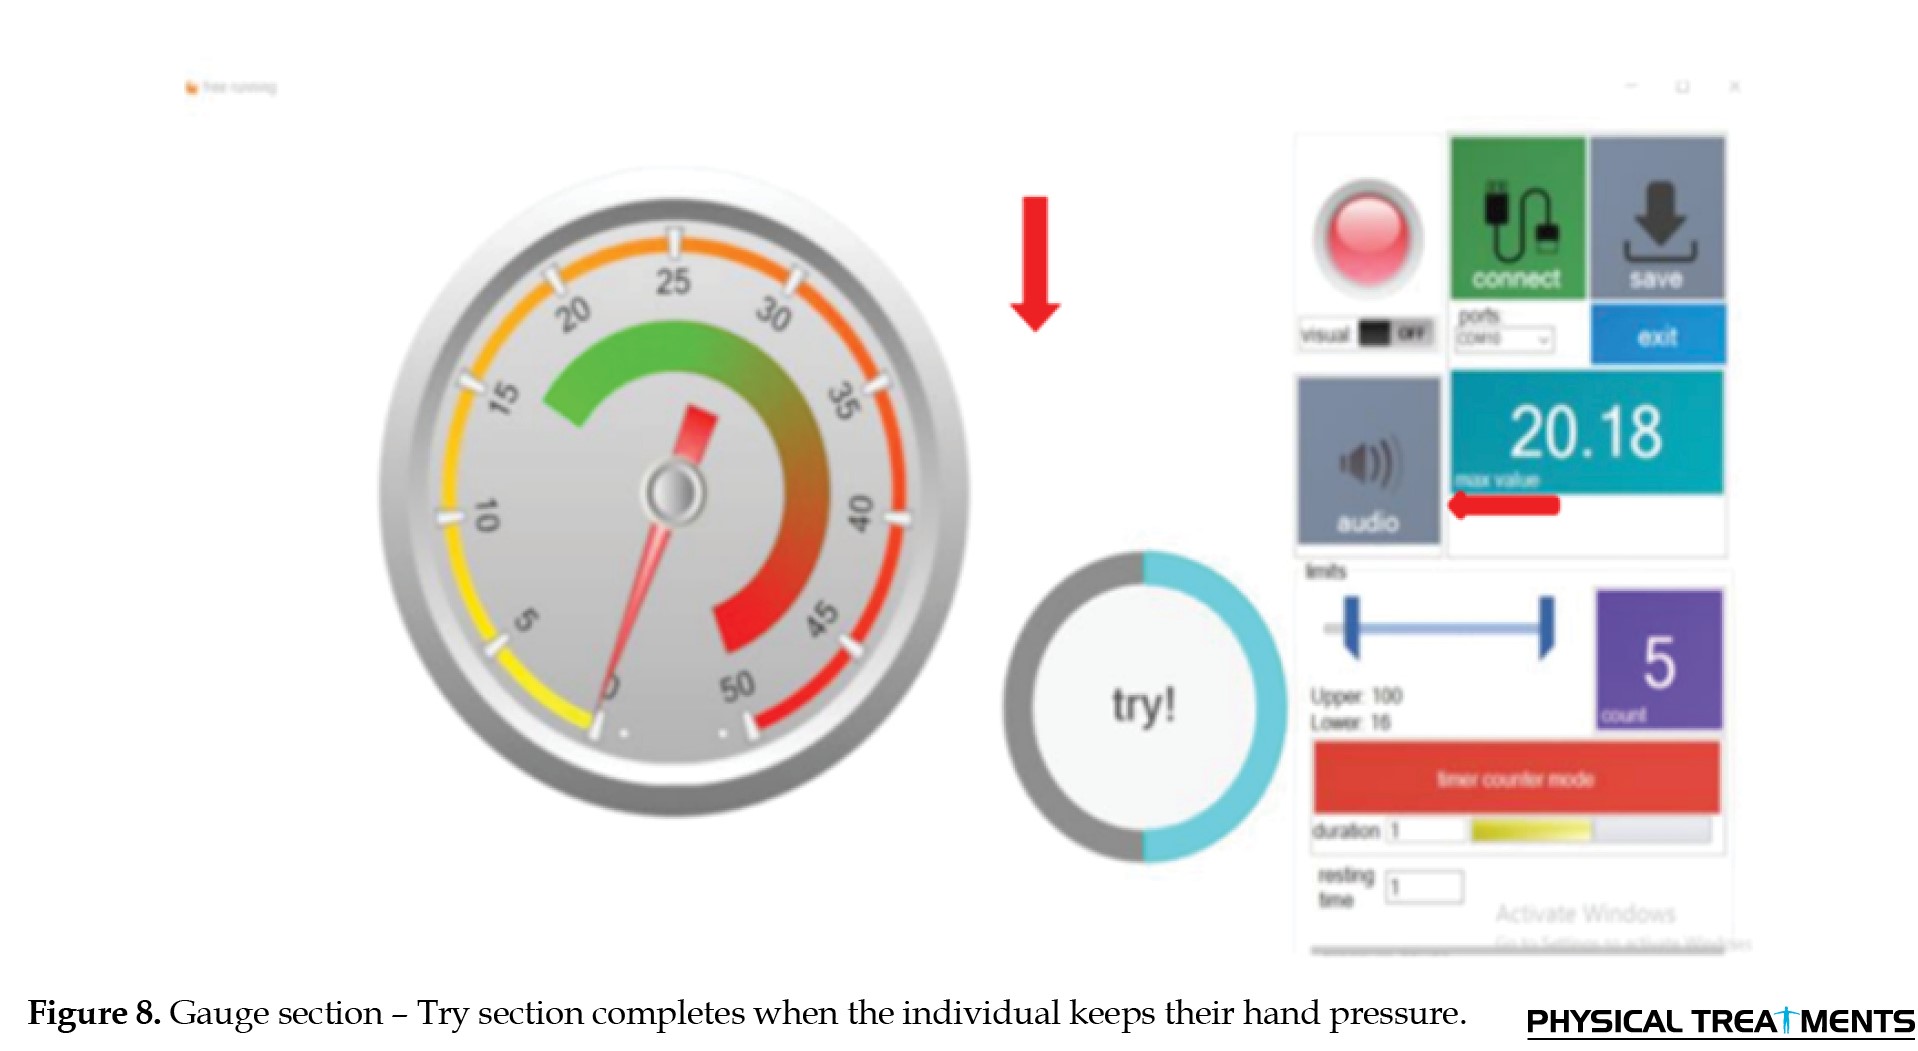
 In the second group, in the gauge segment, the participants were instructed to press the cuff according to the given command and then rest their hands. Two items were observed in the program. The first item pertains to reaching the low level, passing the high level, and then returning to the low level, which the counter counts each time it is performed. The second item is related to endurance and is activated by the “mode counter timer’ button. The study required 50 trials, and the participants were instructed to perform the task in two sets of 20 trials each, with an additional final set of 10 trials. As a result, the individual had to press and release the cuff 50 times. In another section of the gauge program, the duration of the activity was taken into account, with a value of 6 s, indicating that the individual must hold the cuff with hand pressure for 6 s, and the resting time was set to 6 s for this study. Each time an individual remains within the entire range, the counter counts. Altogether, these individuals performed the test for 10 min. One minute rest was taken after 20 presses, another one minute rest after 20 presses for the second time, and one minute rest after 10 presses for the last time (Figures 7 and 8).
 For the third group, one of the pattern-following software programs of the device, known as the sinusoidal pattern, was subsequently selected. This time, the task done by the participants at the beginning of the experiment was put on repeat mode, and the group was instructed to adjust the hand pressure to track the pattern as closely as possible and maintain this pressure for 12 minutes. This process was performed by compressing the cuff for 2.5 min and then allowing a rest period of 30 s, which was repeated four times (Figure 9).
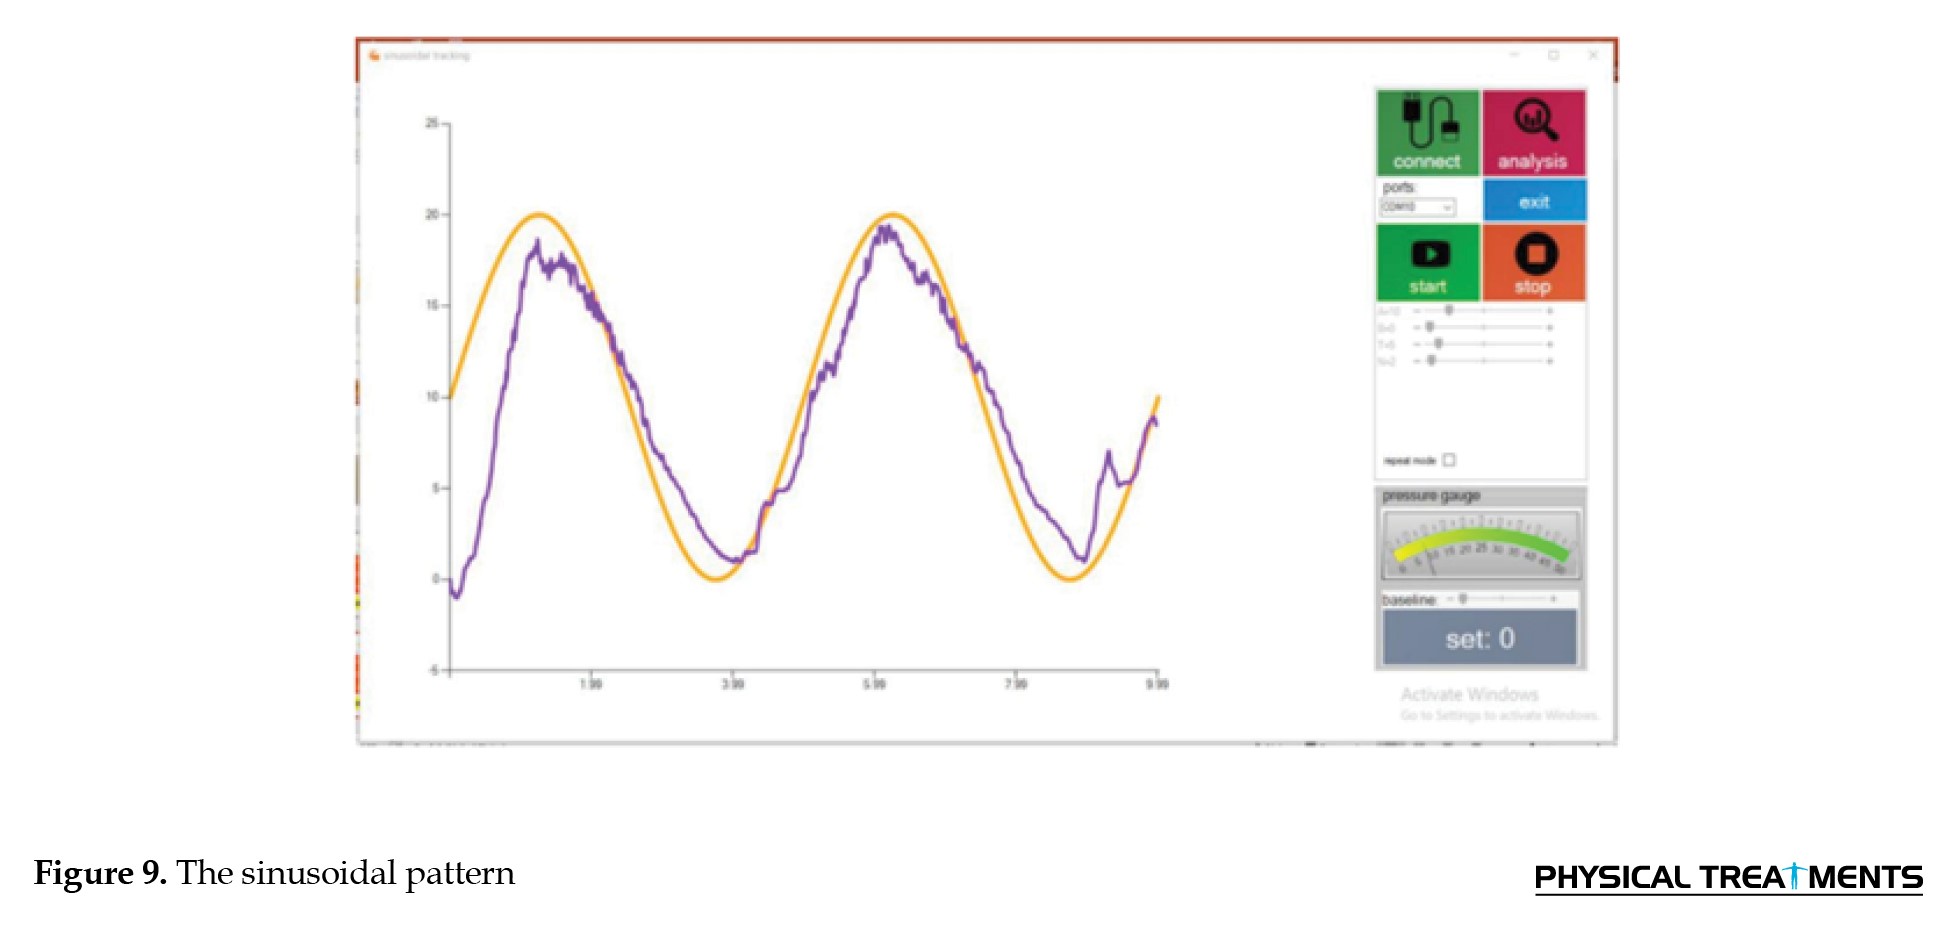 The orange-colored pattern is the desired pattern the examiner selects according to their diagnosis. The purple graph is the pattern the test-taker follows.
The fourth experimental group functioned as the control group, and their performance was assessed through the completion of three games and tracking tasks, as well as the measurement of a gauge. The examiner recorded a 4-minute video of each task and presented it to the individuals in the fourth group. During this process, the individual was instructed to press the cuff, which was not connected to any device, and to provide no feedback on their performance.
After the test has been done for each group, the examiner will perform a postassessment test. In this test, each individual was asked to perform the test that they had done before the beginning of the test (pattern-tracking segment). Following completing these assessments, all participants from all four groups provided numerical data (Figure 10).
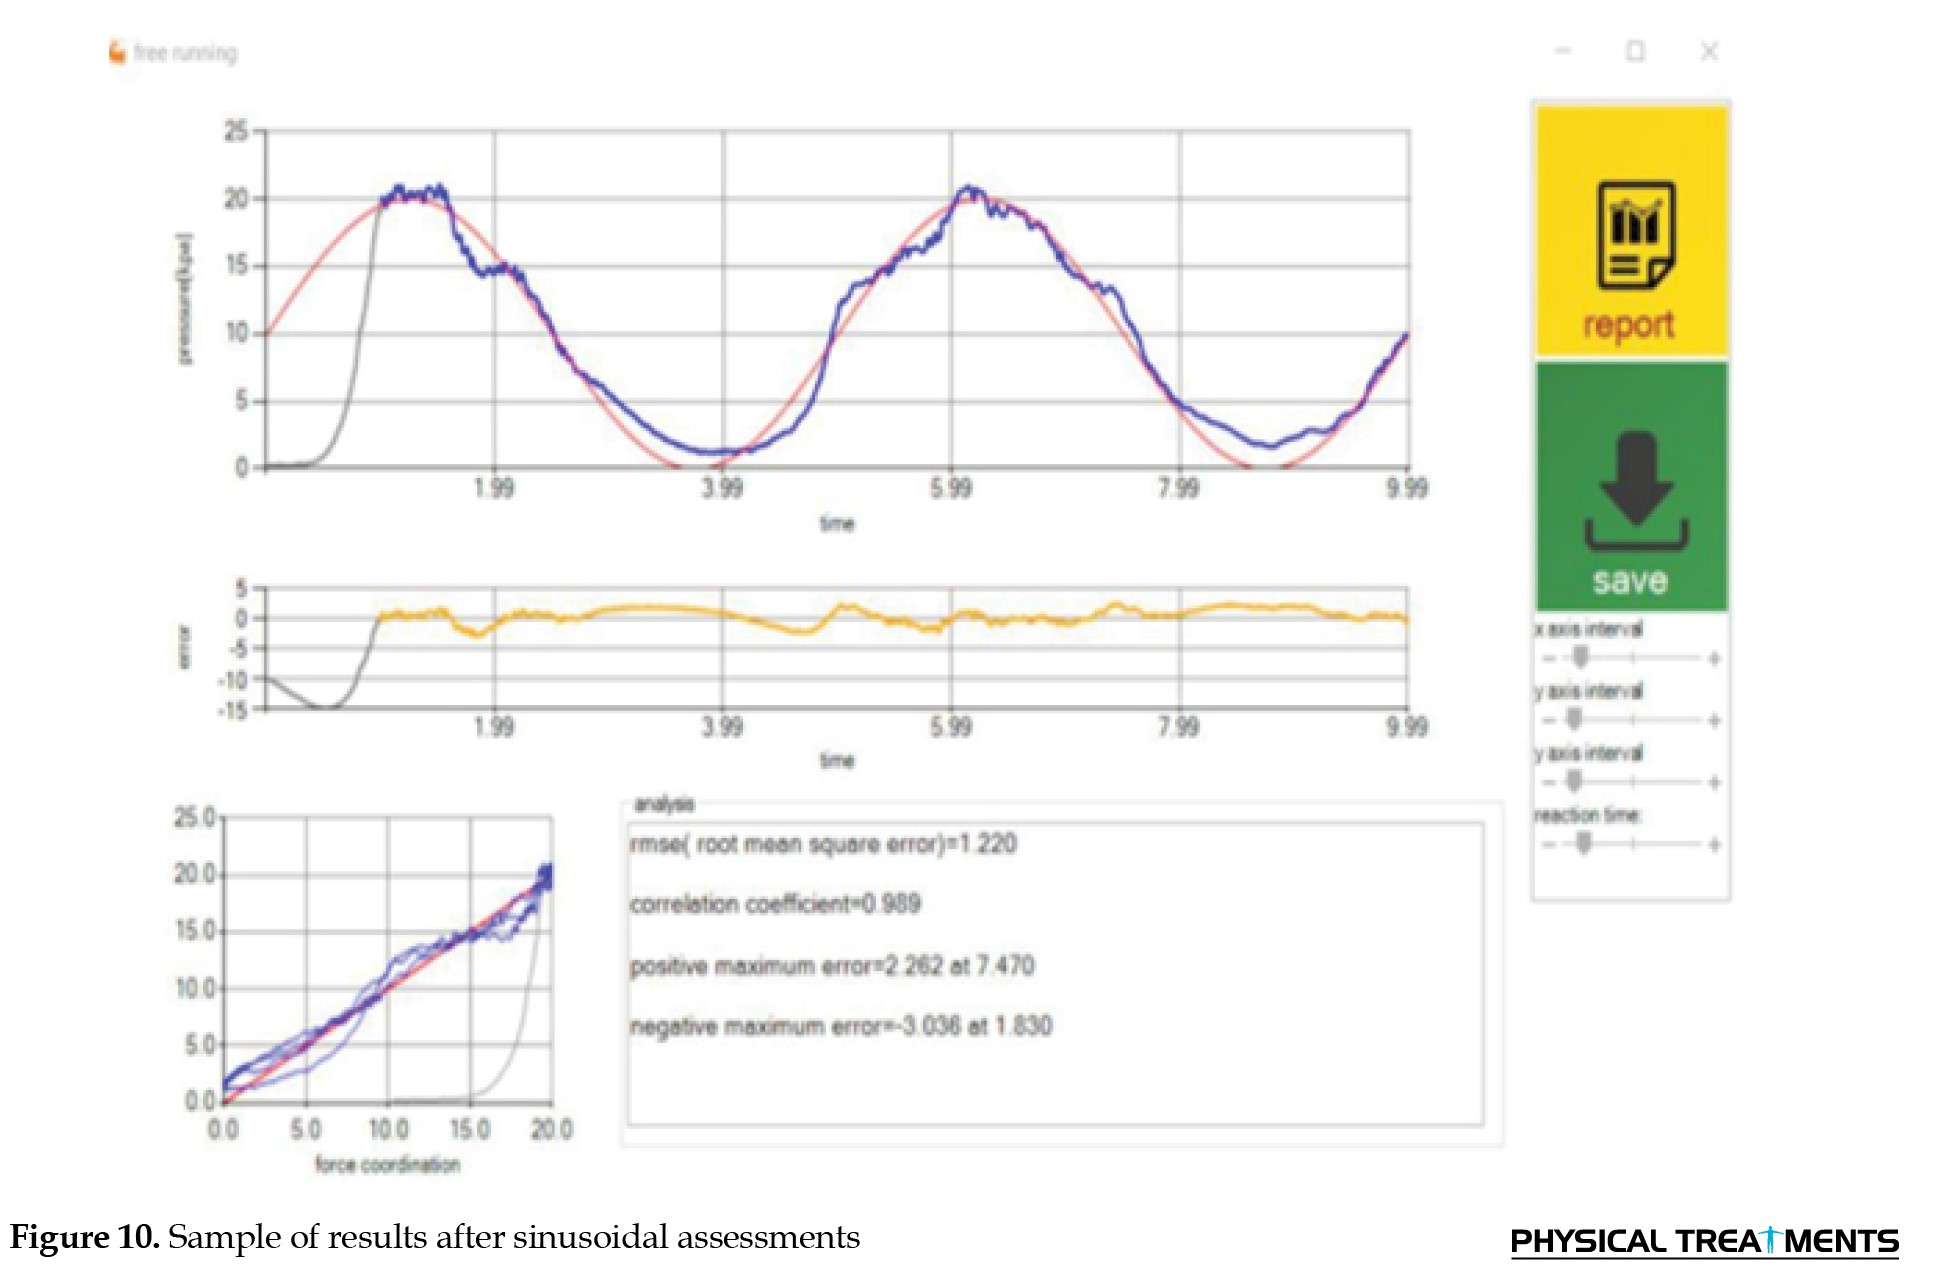 The provided image presents information regarding the display of various graphical representations, such as the desired pattern, pattern performed by the individual, error graph, and correlation curve, which determines the similarity level between the individual’s performance and the desired pattern set by the examiner. The image also shows the quantitative determination of an individual’s motor performance improvement based on parameters such as the mean error, correlation, maximum upper deviation, and maximum lower deviation from the set pattern. Correlation is one of the obtained variables and is a numerical value between 1 and -1, where 1 indicates the highest similarity to the desired pattern, and -1 indicates the lowest similarity to the desired pattern. The image further shows the setting of the reaction time for the start of the final measurement, which is 200 ms for women and 250 ms for men, and the presentation of the maximum jump to the positive side and the maximum jump to the negative side as other variables. The image concludes by stating that the obtained numbers were saved in photo and Notepad file formats and that these numbers were subsequently entered into Excel to get the final results. Noticeably, the device was engineered to maintain consistent effort across all software programs, ensuring that variations did not influence participants’ responses to software-specific requirements. This design feature helped to minimize errors and ensure the reliability of the results.
Results
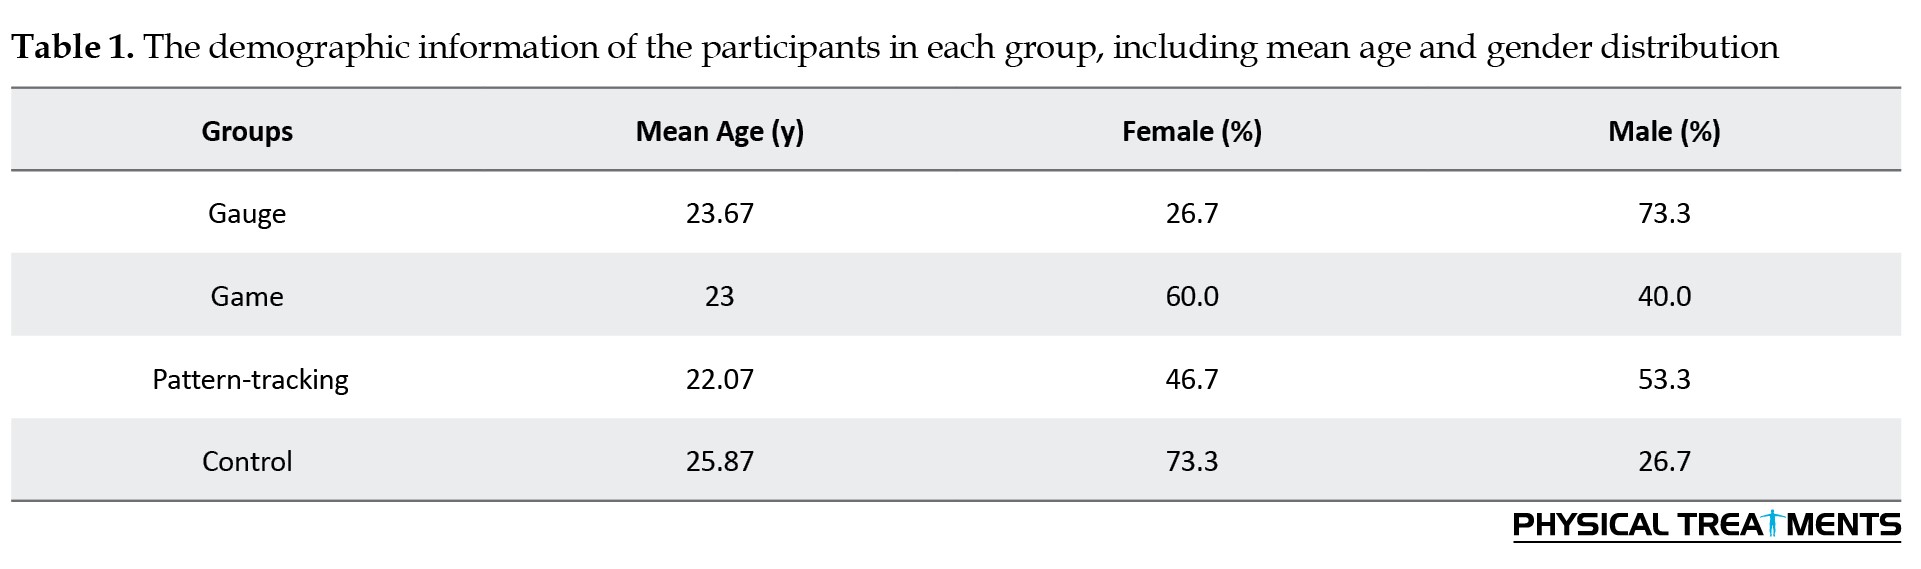
The mean age of the participants in the first group was 23.67 years, with 26.7% being female and 73.3% male. In the second group, the mean age was 23 years, with 60% of the participants being female and 40% male. In the third group, the mean age was 22.07 years, with 46.7% of the participants being female and 53.3% being male. In the fourth group, the mean age was 25.87 years, with 73.3% of the participants being female and 26.7% being male. Across all the groups, 51.7% of the participants were female, and 48.3% were male (Table 1).
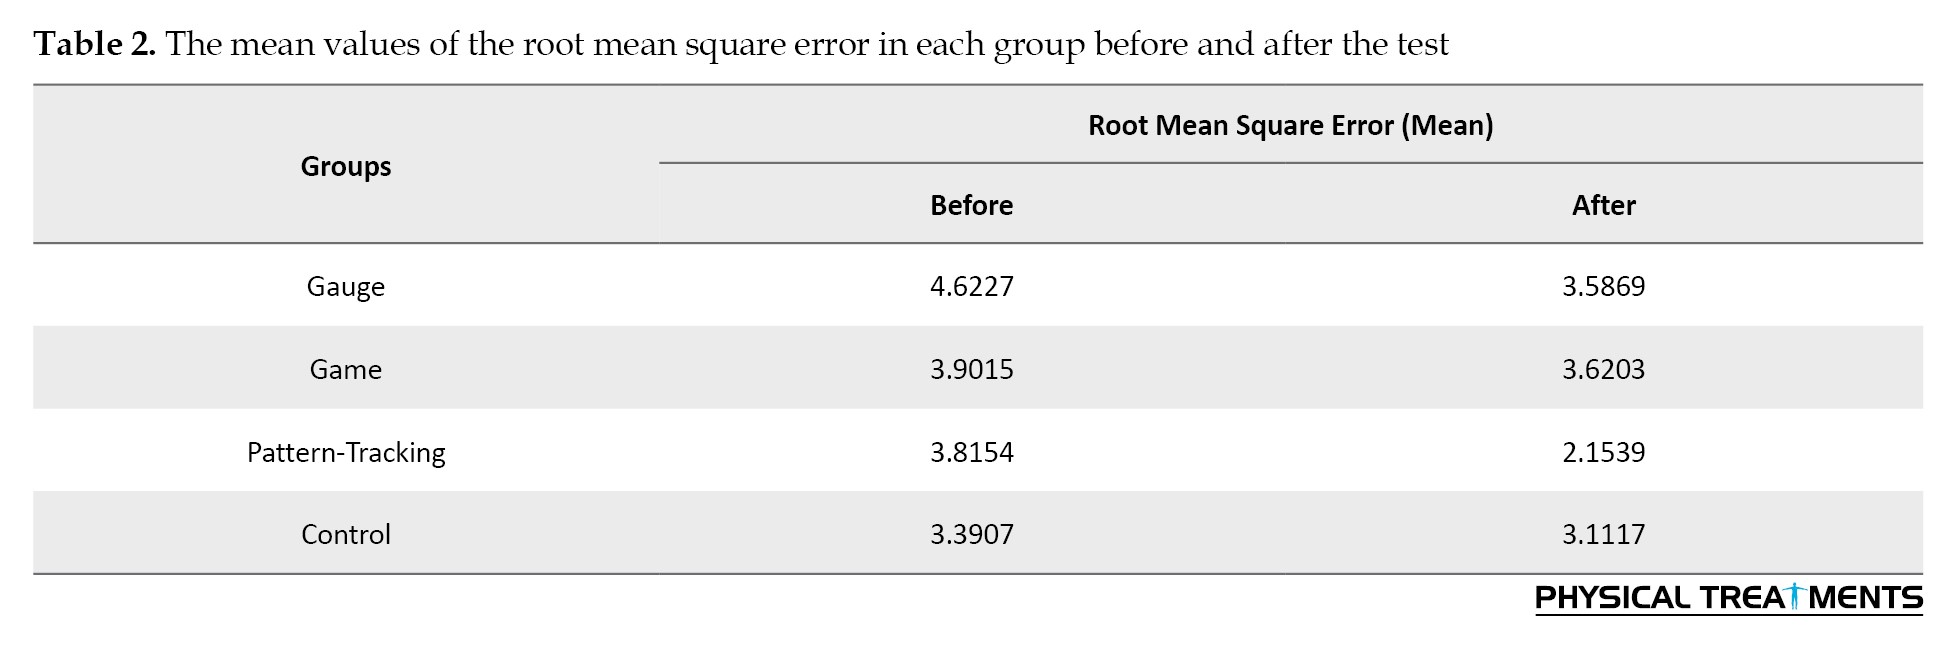
The mean values of the variables, including the root mean square error, correlation, maximum upper deviation, and maximum lower deviation, were calculated for each group before and after the test. In the first group, in which the participants performed the designed game on the device, the root mean square errors before and after the test were 4.6227 and 3.5869, respectively. Similarly, in the second group, where the participants performed exercises with device compression, the root mean square errors before and after the test were 3.9015 and 3.6203, respectively. In the third group, in which the participants followed the displayed pattern on the screen, the root mean square errors before and after the test were 3.8154 and 2.1539, respectively. Finally, in the fourth group (control), the root mean square errors before and after the test were 3.3907 and 3.1117, respectively (Table 2).
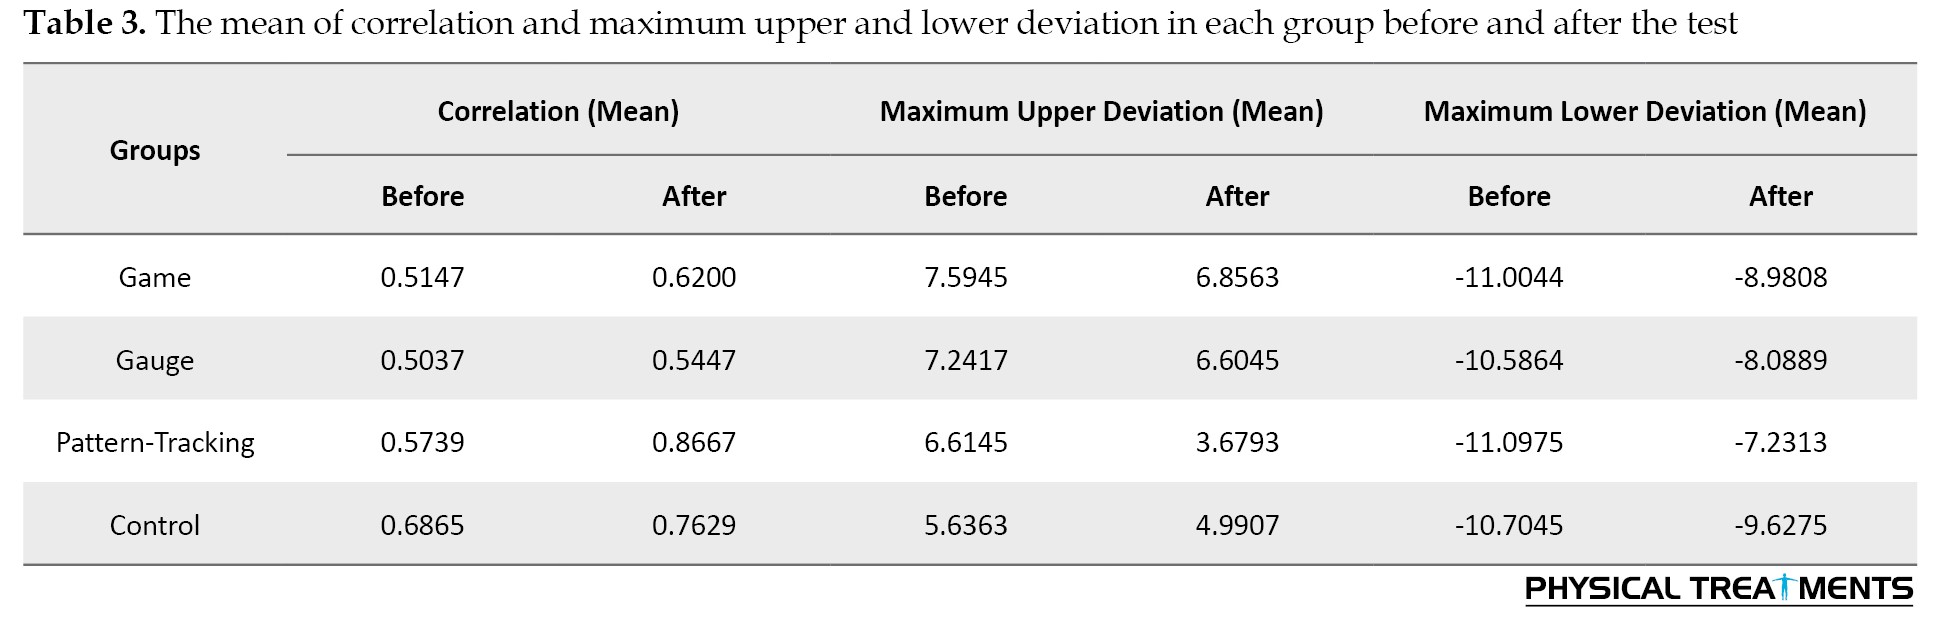
The correlation coefficients for each group before and after the test were as follows. In the first group, the mean correlation before the test was 0.5147, and after the test was 0.6200. For the second group, the mean correlation before the test was 0.5037, and after the test was 0.5447. In the third group, the mean correlation before the test was 0.5739, and after the test was 0.8667, and for the fourth group, the mean correlation before the test was 0.6865 and after the test was 0.7629. Additionally, the mean maximum upper deviations in each group before and after the test were as follows: 7.5945 before and 6.8563 after the test in the first group, 7.2417 before and 6.6045 after the test in the second group, 6.6145 before and 3.6793 after the test in the third group, and 5.6363 before and 4.9907 after the test in the fourth group. The mean maximum lower deviations in each group before and after the test were as follows: In the first group, -11.0044 before and -8.9808 after the test; in the second group, -10.5864 before and -8.0889 after the test; in the third group, -11.0975 before and -7.2313 after the test; and in the fourth group, -10.7045 before and -9.6275 after the test (Table 3).
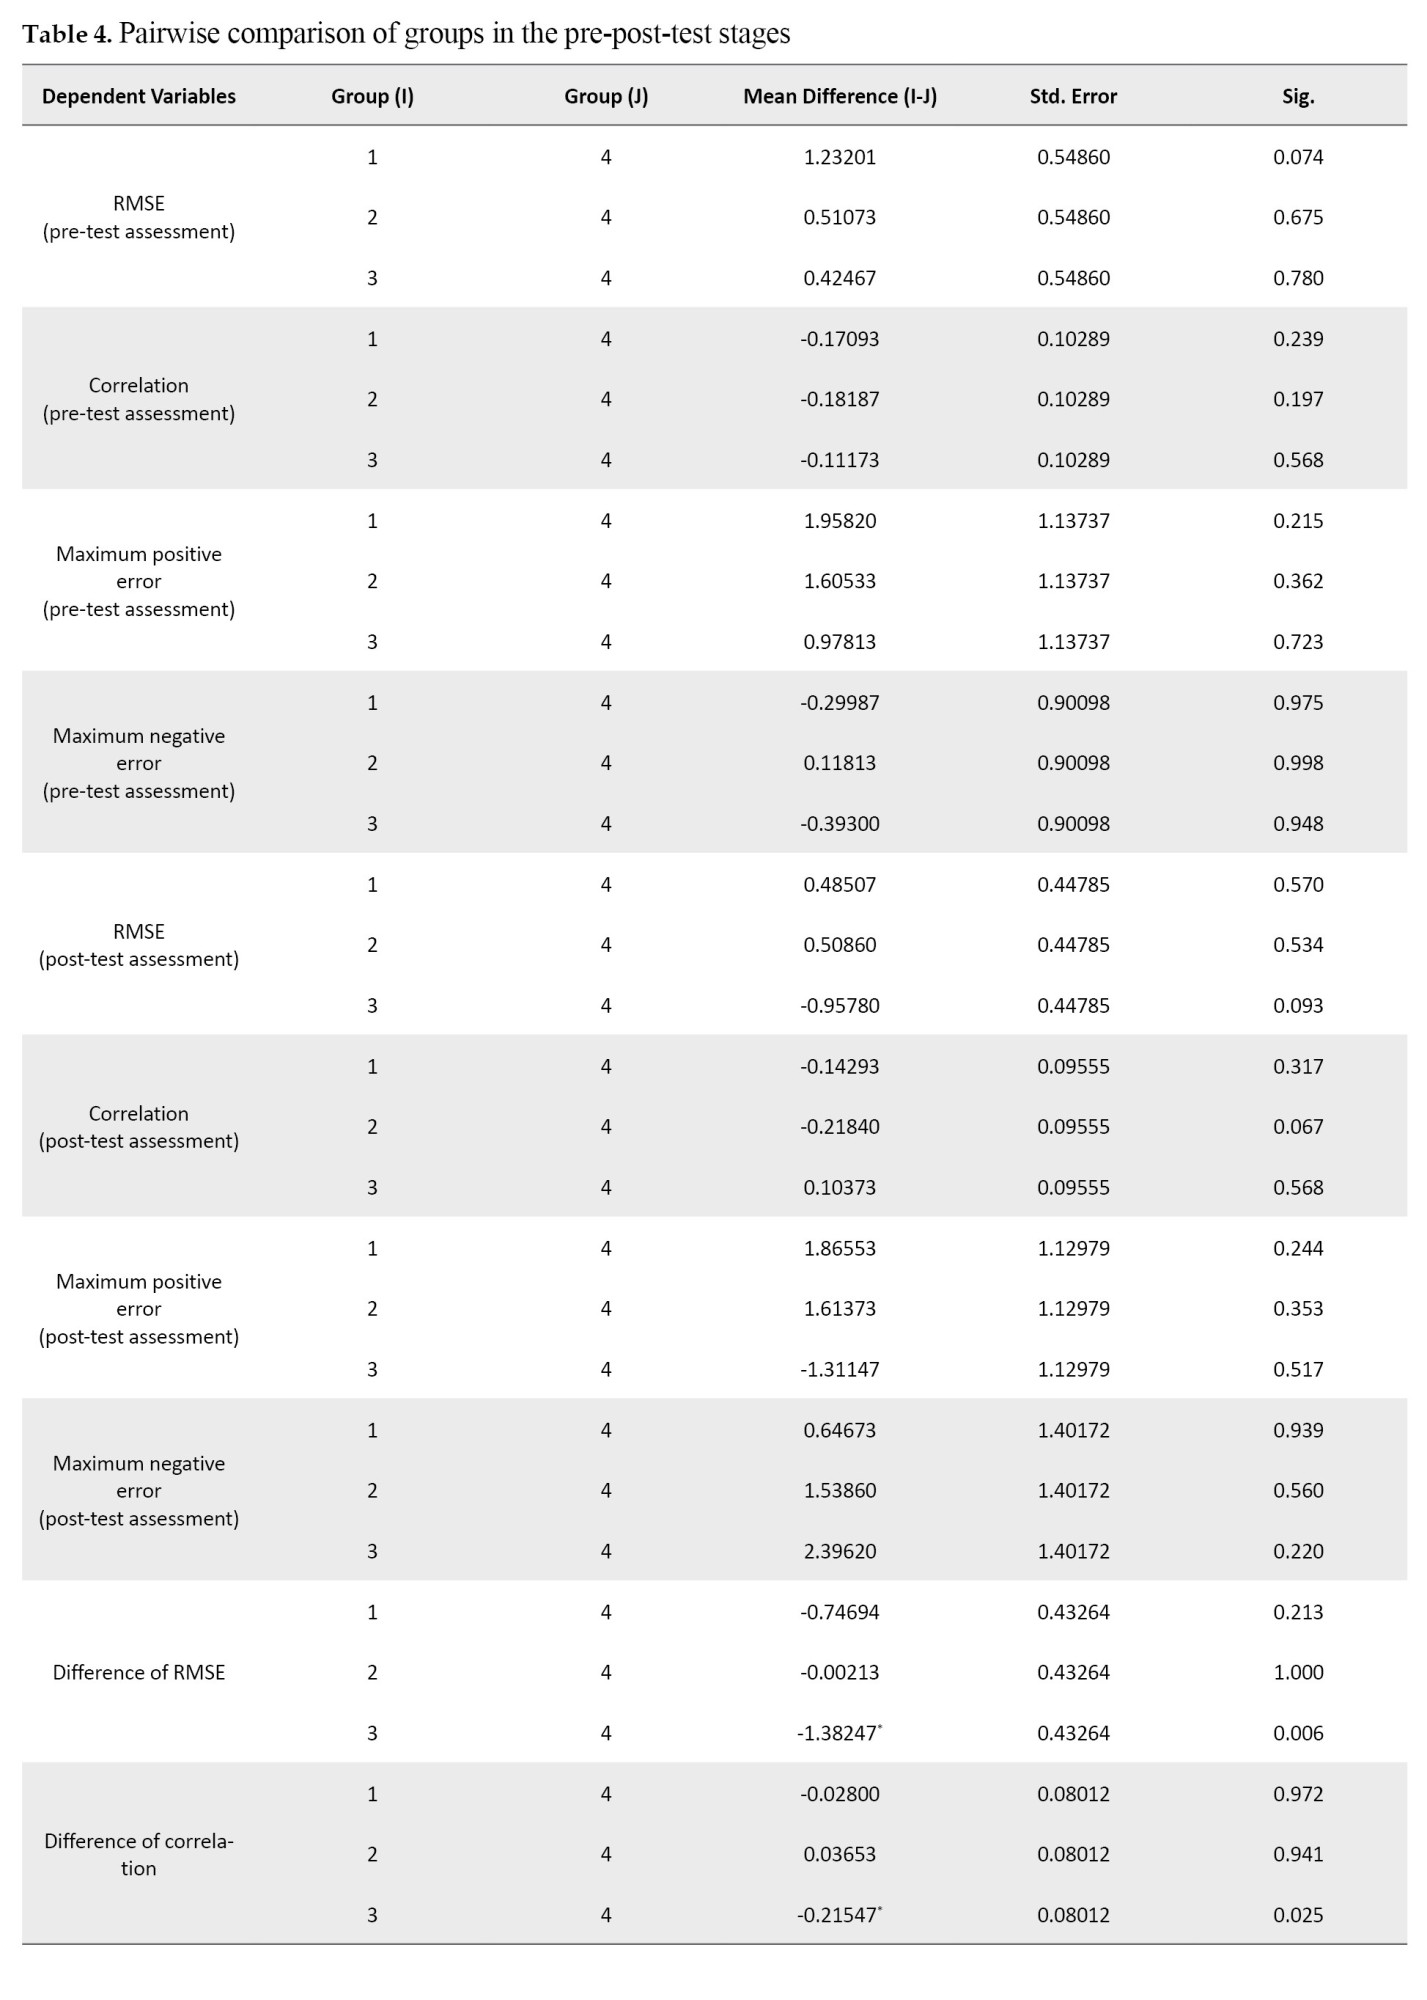
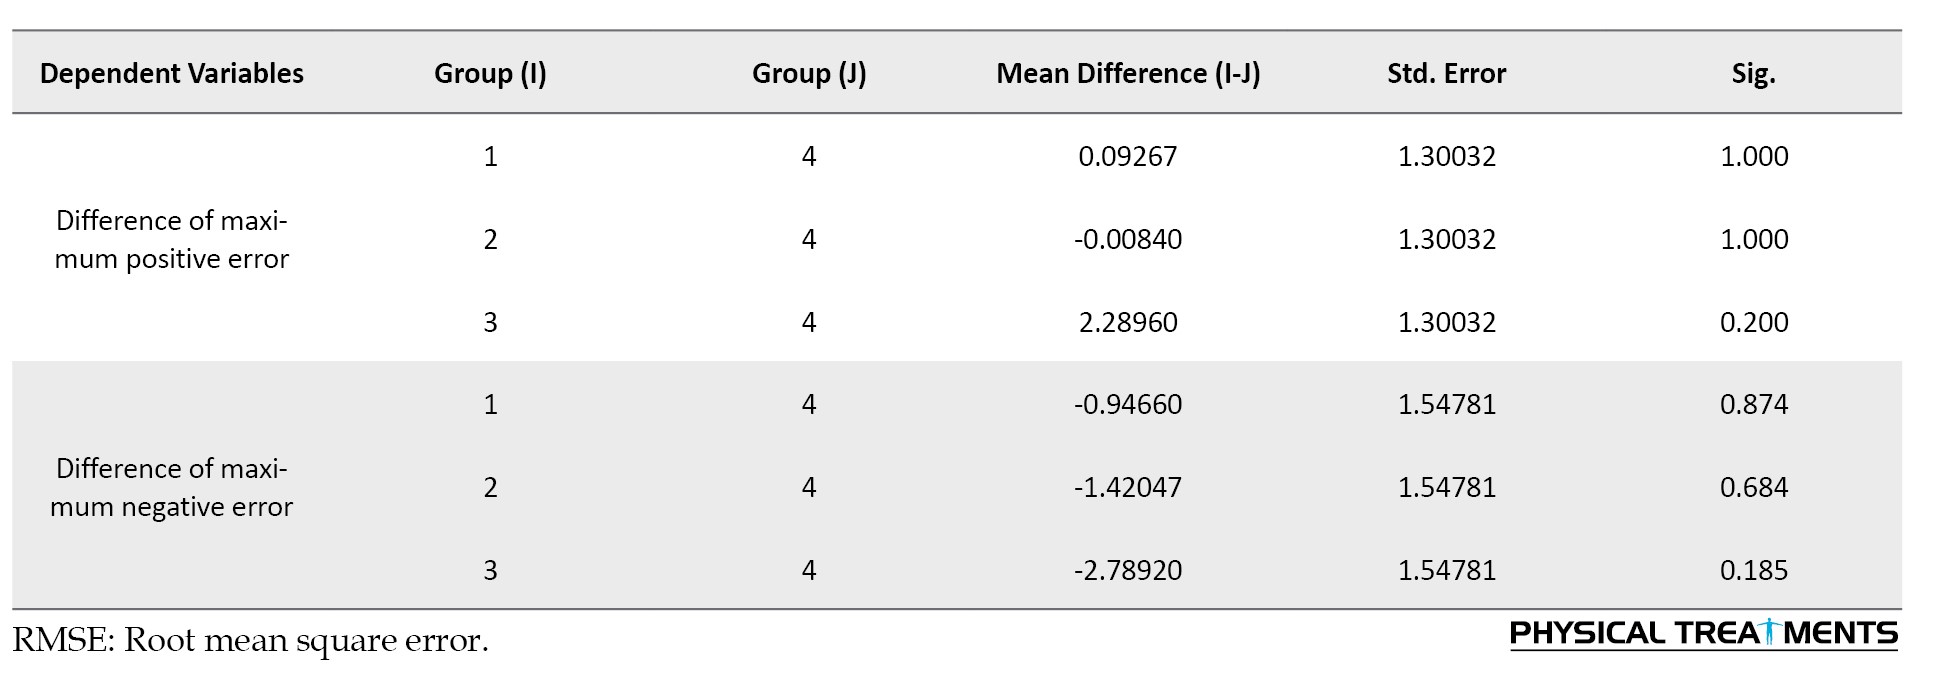
The results of the Dunnett method revealed that the differences between groups 1 and 4 (P=0.7496) and groups 2 and 4 (P=1) were not statistically significant. However, the difference between groups 3 and 4 (P=0.006) was significant, suggesting a change in performance for group 3 after the test (Table 4).
In the paired t-test, comparing variables before and after the test yielded a significance level of 0.05.
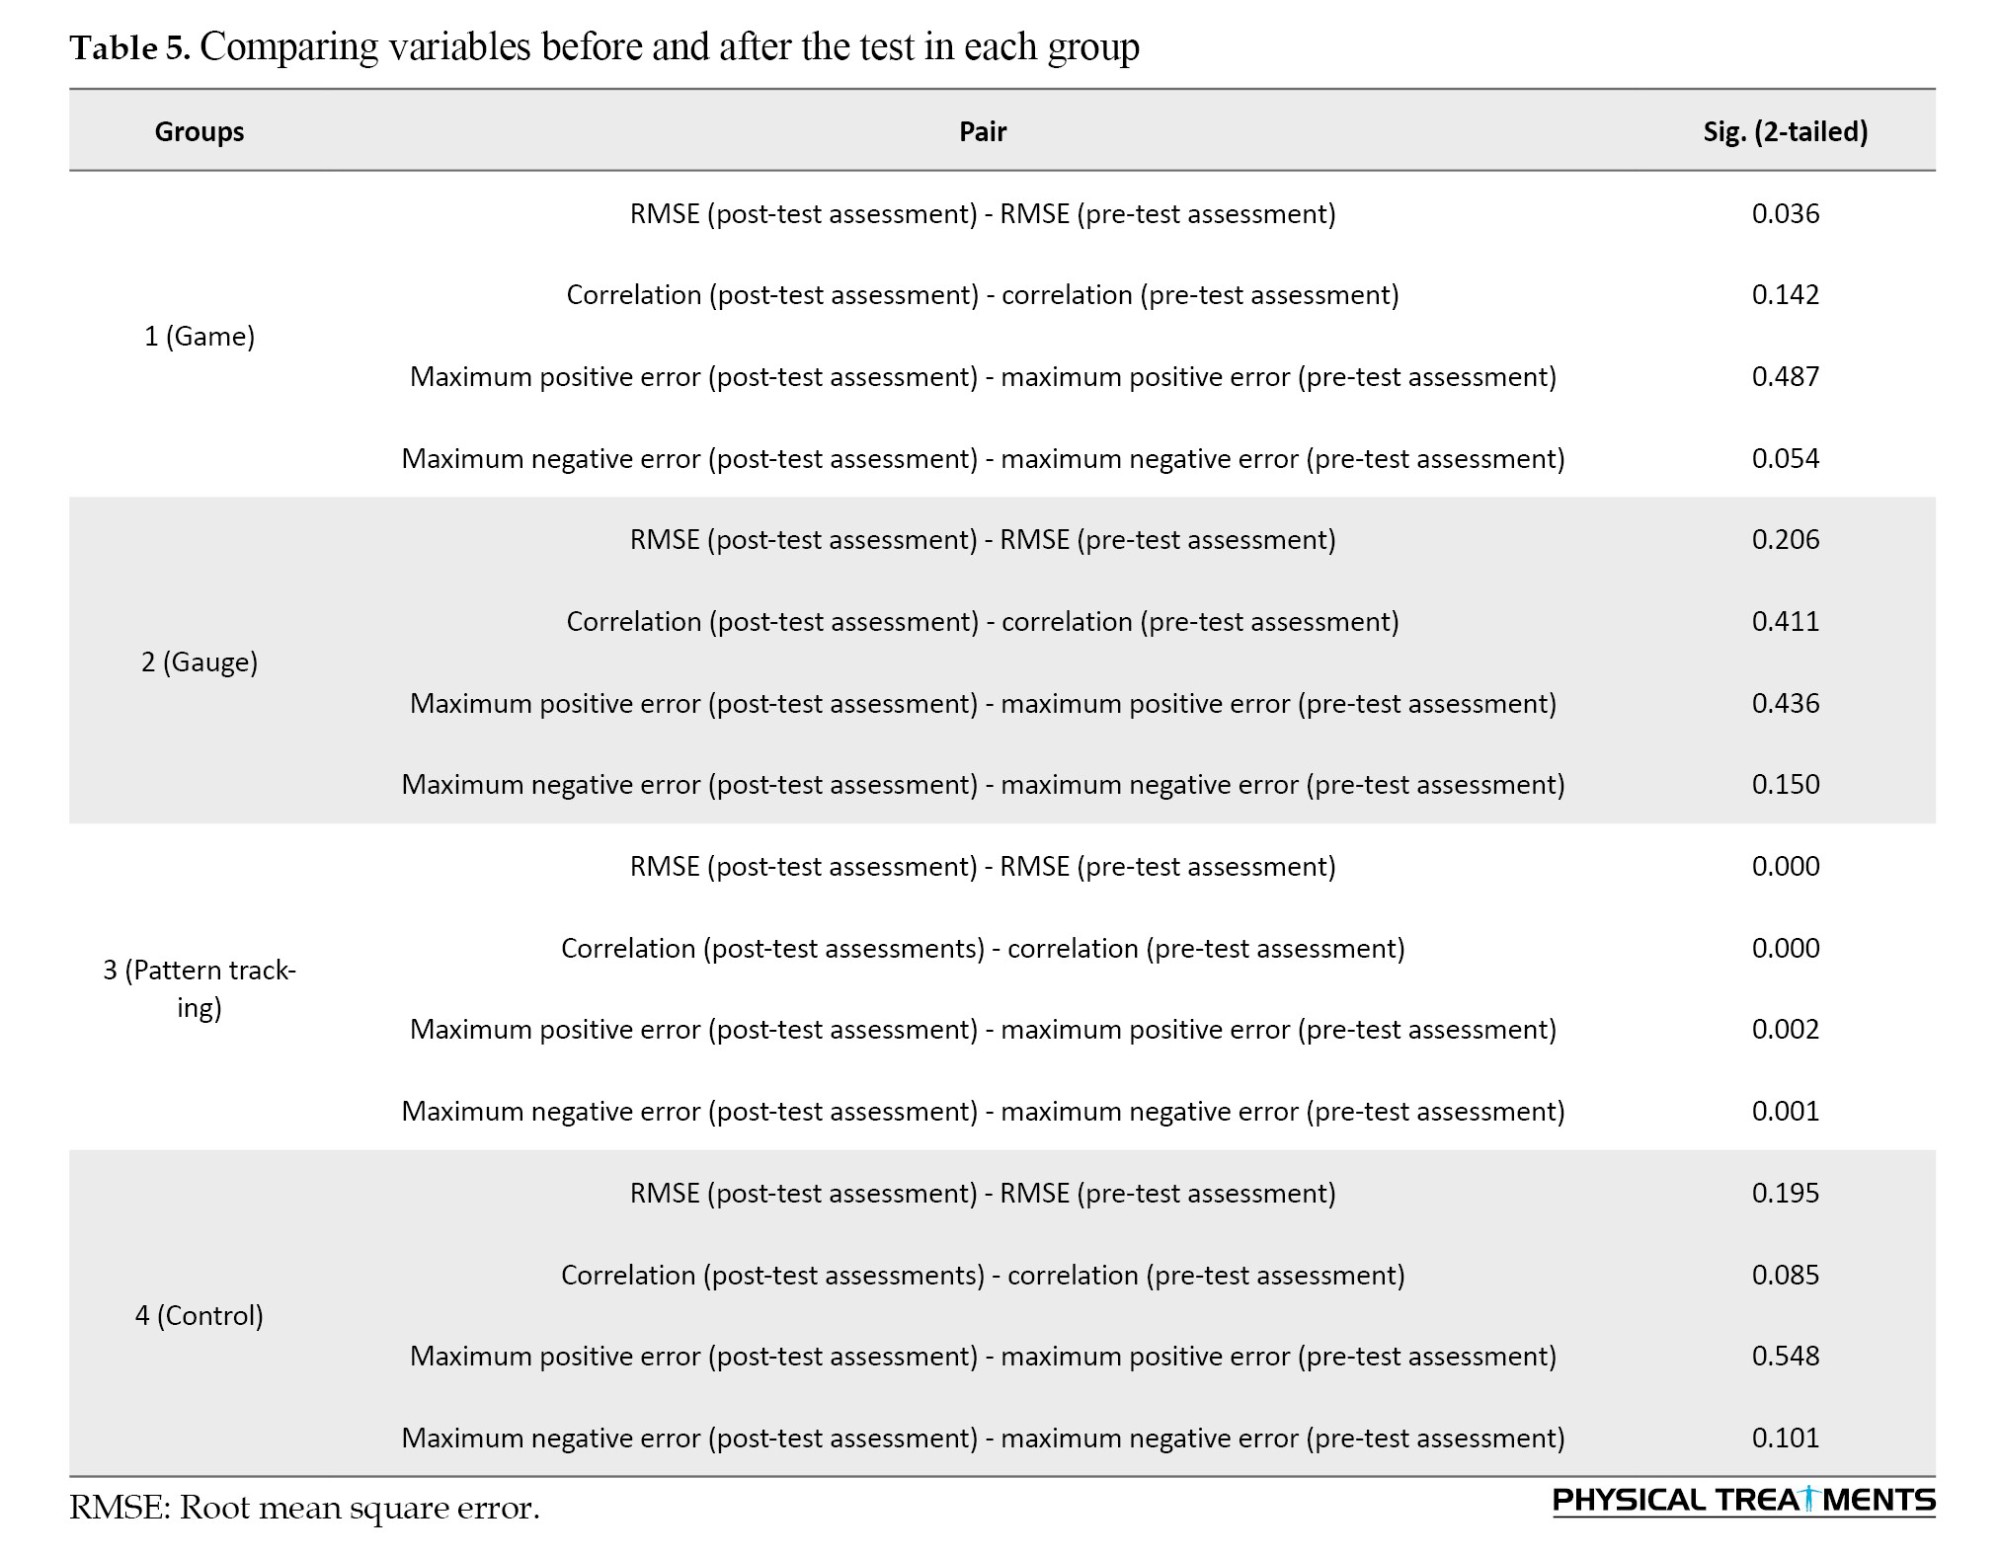
The results of our experiment in group 1 revealed no significant difference in the root mean square error, with a difference of 0.36. Additionally, comparing the correlation variables did not indicate a significant difference (P=0.142). The maximum upper deviation variable showed no significant difference (P=0.487). However, the maximum lower deviation variable had the significance difference (P=0.054). Based on these findings, we can conclude that there was no significant improvement in motor function in the hand area after performing the test in one session.
In group 2, the paired t-test revealed a negligible difference in the root mean square error of 0.206, which was not statistically significant. Similarly, the correlation variable indicated no notable change in participants’ motor function before and after the test (P=0.411). In the paired comparison of the third variable (maximum upper deviation), there was no significant difference before and after the test (P=0.436). However, for the fourth variable (maximum lower deviation), there was a significance difference (P=0.150). Hence, the outcomes demonstrated no substantial improvement in the motor function of the hand area in Group 2 after a single testing session.
The statistical analysis of our study in group 4 revealed no significant change in the root mean square error (P=0.195). Similarly, the correlation variable suggested no significant difference (P=0.085). For the third and fourth variables, maximum upper deviation and maximum lower deviation, the paired comparison results showed no significant differences before and after the test (P=0.548 and P=0.101, respectively). Our study in group 4 revealed no significant improvement in motor function in the hand area after performing the test in one session.
In Group 3, the paired t-test revealed a substantial difference in the root mean square error (P<0.001), which was statistically significant. This finding suggests a significant difference between the variables before and after the test. In addition, the correlation variable indicated a significant difference (P<0.001). Concerning the paired comparison of the third variable, the maximum upper deviation suggested a statistically significant difference before and after the test (P=0.002). For the paired comparison of the fourth variable, the maximum lower deviation, there was a significant difference (P=0.001). Overall, the results of our experiment in group 3 indicate a significant difference in the variables following a single testing session (Table 5).
Discussion
According to the study findings, age does not significantly affect the various groups’ performance. These findings suggest that, among individuals aged 18 to 35 years, their physiological conditions and motor function improvement are similar. Moreover, the study reveals that sex has no relationship with motor function improvement, which was influenced by the type of experiment in which the participants were involved.
The findings of this study support the effectiveness of biofeedback interventions in improving motor performance in hand. The pattern-tracking group demonstrated significant motor performance improvement, aligning with existing research suggesting biofeedback can be an effective tool in enhancing neuromuscular function [21]. The results of this study have implications for the development of effective biofeedback interventions for motor performance improvement in individuals with hand-related motor impairments. The study’s findings can be applied to various populations, including athletes and individuals in different lines of work, who can benefit from improved motor performance in their hands. Furthermore, the conclusions can be generalized to other areas of motor function improvement, such as rehabilitation and ergonomics [22]. The use of biofeedback in motor performance improvement is not a new concept, and previous studies have shown its effectiveness in various areas, such as masticatory muscle activity management [21] and everyday stress management [23].
The study focuses on improving motor function through task-oriented and part versus whole training approaches. The Motor Control book by Shumway-Cook [24] supports these findings, emphasizing the importance of functional tasks and adaptability to environmental changes.
Part versus whole training allows the individual to attain a professional level in each component, known as task analysis [24, 25]. In our study, participants were initially asked to perform a pattern from the pattern-tracking segment—those in the third group who practiced the pattern in smaller and more parts performed better than others.
Conclusion
The study demonstrates that individuals who utilize diverse techniques to address problems or execute motor tasks have a higher success rate than those who rely solely on muscle activation to follow a set pattern. This finding suggests adaptability and task analysis are crucial for relearning and improving motor function. This study demonstrated this result, where individuals from the pattern-tracking group presented enhanced motor function, as they were compelled to utilize various nerves and adapt to new conditions because of the altered pattern location on the screen. This improvement was evident even after a single session.
Overall, the findings suggest that practicing functional tasks, adapting to environmental changes, and breaking down motor tasks into smaller components can lead to enhanced motor function and improved performance.
This study had several limitations. These limitations include a small sample size, inadequate assessment tools, and lack of investigation into long-term effects. Addressing these limitations in future research is crucial for providing a more comprehensive understanding of motor performance improvement.
Ethical Considerations
Compliance with ethical guidelines
All ethical principles are considered in this article. The participants were informed of the purpose of the research and its implementation stages. They were also assured about the confidentiality of their information and were free to leave the study whenever they wished, and if desired, the research results would be available to them. A written consent has been obtained from the subjects. The principles of the Helsinki Convention were also observed.
This study was approved by the Ethics Committee of the University of Social Welfare and Rehabilitation Sciences (Code: IR.USWR.REC.1402.172).
Funding
The paper was extracted from the master's thesis of Ayda Ebrahimi, approved by Department of Ergonomics, Faculty of Rehabilitation, University of Social Welfare and Rehabilitation Sciences, Tehran, Iran.
Authors' contributions
All authors contributed equally to the conception and design of the study, data collection and analysis, interception of the results, and manuscript drafting. Each author approved the submission of the final version of the manuscript.
Conflict of interest
The authors declared no conflict of interest.
Acknowledgments
We are deeply grateful to the students who participated in this study, without whom this research would not have been possible. Their willingness to participate and provide data has been invaluable for the success of this project.
References
The scientific method for evaluating and estimating muscle activity involves recording, measuring, and analyzing the biological signals produced during muscle contraction. This method is based on the use of equipment that allows for the comparison of the type of activity and amount of muscle work with the changes in the indicators of the signals. Importantly, any body movement and physical activity under different conditions is caused by the activity and contraction of muscles related to that movement [1, 2]. One of the techniques commonly utilized is biofeedback. Biofeedback is a process that involves monitoring and providing biological data to an individual and has been rooted in the field of physiological psychology since the 1960s [3, 4]. Biofeedback is a straightforward and efficient approach that can be applied to many individuals to enhance neuromuscular function. This technique involves attaching electrical sensors to the individual, which measure and process information related to the body’s nerves, muscles, and autonomous activities. The sensors then provide audio or video feedback to the individual and the therapist. Biofeedback’s primary objective is to understand voluntary actions through audio or visual means and enable individuals to consciously alter their physiological actions to achieve optimal health [5]. Biofeedback involves instrumentation to provide an individual with real-time information about a specific physiological process regulated by the autonomic nervous system that is not fully understood. During biofeedback training, the individual actively works toward restoring health and may passively accept instructions to a greater or lesser extent [1].
In rehabilitation, the incorporation of games are embraced due to their persuasive and motivational capabilities and their capacity to establish reward systems. Although these elements are regarded as significant contributors to the therapeutic outcomes of interventions, it is essential to recognize that they do not guarantee the desired therapeutic results. Despite this limitation, using games for rehabilitation has remained a vital component. One notable aspect of these games is their reward system, which engages the neural system to facilitate long-term learning—something that cannot be easily disregarded [6]. The concept of gamification involves incorporating game design elements into nongame contexts. Numerous studies have demonstrated its effectiveness in boosting motivation and engagement in various fields, including education. Research has shown that gamification can enhance learning experiences by fostering a more committed and motivated mindset among learners [7, 8]. Conventional and interactive games, which utilize gaming software, are designed to increase motivation for exercise performance in biofeedback [9].
Pattern tracking in biofeedback refers to monitoring and analyzing the patterns of physiological responses, such as brainwaves, muscle tone, skin conductance, heart rate, and pain perception, to gain greater awareness and control over these functions [10, 11]. One key study on pattern tracking in biofeedback is the biofeedback training for pattern recognition study, which found that participants who used the pattern similarity biofeedback system showed a significant improvement in their classification score for the retrained gesture [10].
Visual gauge biofeedback is a method of biofeedback therapy that utilizes visual cues to provide individuals with information about their physiological responses, such as muscle activity [12]. Visual gauge biofeedback is useful in treatment, mainly motor function and gait rehabilitation. Various studies have demonstrated its effectiveness, and it is a valuable resource for individuals and therapists alike [13].
Motor skills and motor learning are essential components of hand biofeedback, a technique that improves motor control and performance in individuals with various motor disorders [14]. Motor skills are acquired through repeated practice to control the movements of joints and body parts voluntarily. Scientists call this process motor learning, control, or skill acquisition. Studying motor learning and control is crucial for enhancing performance and promoting rehabilitation. The upper limb’s movement function includes grasping and extending toward objects and maintaining a hold on them [15]. Individuals with information about their muscle activity have been shown to modestly improve motor control compared to the ones with impaired hands [16]. A study was conducted in an electronic parts manufacturing factory to examine the effectiveness of the two interventions in reducing muscle tension in the hand area. The first group received muscle learning therapy, whereas the second group utilized adult learning methods and cognitive behavioral techniques to enhance their ability to manage muscle tension symptoms in the hand area, stress, and problem-solving. The workers were randomly divided into the control and intervention groups. Baseline data were collected before training via symptom notes and electromyography recordings of the trapezius and forearm muscles of the left and right arms. After 6 weeks, significant differences were observed between the control and intervention groups. The control group presented increased muscle tension, the second group demonstrated a significant decrease, and the first group presented little change. These disparities were not sustained in the subsequent evaluations. The first group continuously increased their capacity to reduce muscle tension in the trapezius region after 6 and 32 weeks and demonstrated some efficacy for the forearm [17].
Motor learning and motor performance are two distinct concepts that are related but not interchangeable. Motor learning is about acquiring the ability to produce skilled actions through practice and experience, resulting in a relatively permanent change. On the other hand, motor performance is about executing a motor skill; various factors and results can influence a temporary, non-permanent change [18].
Studies on hand motor performance are necessary to deepen our understanding of the complex interactions between cognitive processes, neural control, and physical movements involved in hand function. These studies aim to uncover the underlying mechanisms influencing hand performance and the factors contributing to individual differences in hand function. Research in this area seeks to improve motor skills and performance, which are crucial for everyday activities, work, and overall quality of life. By investigating the effects of various factors, such as handedness, sex, and motor practice, on hand motor performance, scientists can develop more effective training methods and interventions to enhance motor skills [19]. Research on hand motor performance contributes to understanding the intricate relationships between brain function, cognitive processes, and physical movements. By exploring the neural mechanisms underlying hand motor control, scientists can advance our knowledge of brain-body interactions and develop more effective interventions for motor disorders [20].
Materials and Methods
At the outset, the research plan was shared with individuals who expressed interest and were willing to participate. Informed consent was obtained from all the participants. To ensure the validity and reliability of the study, the following inclusion and exclusion criteria were established.
Inclusion criteria
Participants must be between 18 and 35 years old. They must be currently studying and not have any known balance-related problems or conditions (e.g vertigo, inner ear disorders, etc.). Also, they must not have any known hand-related issues or conditions (e.g arthritis, carpal tunnel syndrome, etc.).
Exclusion criteria
Participants who did not wish to participate in the study, experienced pain or discomfort during the study, and became tired or fatigued during the study were excluded. These criteria were established to ensure that the study population is representative of the target population and to minimize any potential biases or confounding variables.
Sixty individuals were randomly assigned to one of four groups. The device was then connected to a display system, and a suitable cuff was attached. The experiment utilized a Pressure Biofeedback MOLEB device to collect data on participants’ pressure responses (Figure 1).
We established the base value (lower limit) as 6 and the upper limit as 70% of the individual’s MVC strength (Figure 3).
The first group was chosen to participate in the Aircraft game (Figure 5).
The fourth experimental group functioned as the control group, and their performance was assessed through the completion of three games and tracking tasks, as well as the measurement of a gauge. The examiner recorded a 4-minute video of each task and presented it to the individuals in the fourth group. During this process, the individual was instructed to press the cuff, which was not connected to any device, and to provide no feedback on their performance.
After the test has been done for each group, the examiner will perform a postassessment test. In this test, each individual was asked to perform the test that they had done before the beginning of the test (pattern-tracking segment). Following completing these assessments, all participants from all four groups provided numerical data (Figure 10).
Results
The mean age of the participants in the first group was 23.67 years, with 26.7% being female and 73.3% male. In the second group, the mean age was 23 years, with 60% of the participants being female and 40% male. In the third group, the mean age was 22.07 years, with 46.7% of the participants being female and 53.3% being male. In the fourth group, the mean age was 25.87 years, with 73.3% of the participants being female and 26.7% being male. Across all the groups, 51.7% of the participants were female, and 48.3% were male (Table 1).
The mean values of the variables, including the root mean square error, correlation, maximum upper deviation, and maximum lower deviation, were calculated for each group before and after the test. In the first group, in which the participants performed the designed game on the device, the root mean square errors before and after the test were 4.6227 and 3.5869, respectively. Similarly, in the second group, where the participants performed exercises with device compression, the root mean square errors before and after the test were 3.9015 and 3.6203, respectively. In the third group, in which the participants followed the displayed pattern on the screen, the root mean square errors before and after the test were 3.8154 and 2.1539, respectively. Finally, in the fourth group (control), the root mean square errors before and after the test were 3.3907 and 3.1117, respectively (Table 2).
The correlation coefficients for each group before and after the test were as follows. In the first group, the mean correlation before the test was 0.5147, and after the test was 0.6200. For the second group, the mean correlation before the test was 0.5037, and after the test was 0.5447. In the third group, the mean correlation before the test was 0.5739, and after the test was 0.8667, and for the fourth group, the mean correlation before the test was 0.6865 and after the test was 0.7629. Additionally, the mean maximum upper deviations in each group before and after the test were as follows: 7.5945 before and 6.8563 after the test in the first group, 7.2417 before and 6.6045 after the test in the second group, 6.6145 before and 3.6793 after the test in the third group, and 5.6363 before and 4.9907 after the test in the fourth group. The mean maximum lower deviations in each group before and after the test were as follows: In the first group, -11.0044 before and -8.9808 after the test; in the second group, -10.5864 before and -8.0889 after the test; in the third group, -11.0975 before and -7.2313 after the test; and in the fourth group, -10.7045 before and -9.6275 after the test (Table 3).
The results of the Dunnett method revealed that the differences between groups 1 and 4 (P=0.7496) and groups 2 and 4 (P=1) were not statistically significant. However, the difference between groups 3 and 4 (P=0.006) was significant, suggesting a change in performance for group 3 after the test (Table 4).
In the paired t-test, comparing variables before and after the test yielded a significance level of 0.05.
The results of our experiment in group 1 revealed no significant difference in the root mean square error, with a difference of 0.36. Additionally, comparing the correlation variables did not indicate a significant difference (P=0.142). The maximum upper deviation variable showed no significant difference (P=0.487). However, the maximum lower deviation variable had the significance difference (P=0.054). Based on these findings, we can conclude that there was no significant improvement in motor function in the hand area after performing the test in one session.
In group 2, the paired t-test revealed a negligible difference in the root mean square error of 0.206, which was not statistically significant. Similarly, the correlation variable indicated no notable change in participants’ motor function before and after the test (P=0.411). In the paired comparison of the third variable (maximum upper deviation), there was no significant difference before and after the test (P=0.436). However, for the fourth variable (maximum lower deviation), there was a significance difference (P=0.150). Hence, the outcomes demonstrated no substantial improvement in the motor function of the hand area in Group 2 after a single testing session.
The statistical analysis of our study in group 4 revealed no significant change in the root mean square error (P=0.195). Similarly, the correlation variable suggested no significant difference (P=0.085). For the third and fourth variables, maximum upper deviation and maximum lower deviation, the paired comparison results showed no significant differences before and after the test (P=0.548 and P=0.101, respectively). Our study in group 4 revealed no significant improvement in motor function in the hand area after performing the test in one session.
In Group 3, the paired t-test revealed a substantial difference in the root mean square error (P<0.001), which was statistically significant. This finding suggests a significant difference between the variables before and after the test. In addition, the correlation variable indicated a significant difference (P<0.001). Concerning the paired comparison of the third variable, the maximum upper deviation suggested a statistically significant difference before and after the test (P=0.002). For the paired comparison of the fourth variable, the maximum lower deviation, there was a significant difference (P=0.001). Overall, the results of our experiment in group 3 indicate a significant difference in the variables following a single testing session (Table 5).
Discussion
According to the study findings, age does not significantly affect the various groups’ performance. These findings suggest that, among individuals aged 18 to 35 years, their physiological conditions and motor function improvement are similar. Moreover, the study reveals that sex has no relationship with motor function improvement, which was influenced by the type of experiment in which the participants were involved.
The findings of this study support the effectiveness of biofeedback interventions in improving motor performance in hand. The pattern-tracking group demonstrated significant motor performance improvement, aligning with existing research suggesting biofeedback can be an effective tool in enhancing neuromuscular function [21]. The results of this study have implications for the development of effective biofeedback interventions for motor performance improvement in individuals with hand-related motor impairments. The study’s findings can be applied to various populations, including athletes and individuals in different lines of work, who can benefit from improved motor performance in their hands. Furthermore, the conclusions can be generalized to other areas of motor function improvement, such as rehabilitation and ergonomics [22]. The use of biofeedback in motor performance improvement is not a new concept, and previous studies have shown its effectiveness in various areas, such as masticatory muscle activity management [21] and everyday stress management [23].
The study focuses on improving motor function through task-oriented and part versus whole training approaches. The Motor Control book by Shumway-Cook [24] supports these findings, emphasizing the importance of functional tasks and adaptability to environmental changes.
Part versus whole training allows the individual to attain a professional level in each component, known as task analysis [24, 25]. In our study, participants were initially asked to perform a pattern from the pattern-tracking segment—those in the third group who practiced the pattern in smaller and more parts performed better than others.
Conclusion
The study demonstrates that individuals who utilize diverse techniques to address problems or execute motor tasks have a higher success rate than those who rely solely on muscle activation to follow a set pattern. This finding suggests adaptability and task analysis are crucial for relearning and improving motor function. This study demonstrated this result, where individuals from the pattern-tracking group presented enhanced motor function, as they were compelled to utilize various nerves and adapt to new conditions because of the altered pattern location on the screen. This improvement was evident even after a single session.
Overall, the findings suggest that practicing functional tasks, adapting to environmental changes, and breaking down motor tasks into smaller components can lead to enhanced motor function and improved performance.
This study had several limitations. These limitations include a small sample size, inadequate assessment tools, and lack of investigation into long-term effects. Addressing these limitations in future research is crucial for providing a more comprehensive understanding of motor performance improvement.
Ethical Considerations
Compliance with ethical guidelines
All ethical principles are considered in this article. The participants were informed of the purpose of the research and its implementation stages. They were also assured about the confidentiality of their information and were free to leave the study whenever they wished, and if desired, the research results would be available to them. A written consent has been obtained from the subjects. The principles of the Helsinki Convention were also observed.
This study was approved by the Ethics Committee of the University of Social Welfare and Rehabilitation Sciences (Code: IR.USWR.REC.1402.172).
Funding
The paper was extracted from the master's thesis of Ayda Ebrahimi, approved by Department of Ergonomics, Faculty of Rehabilitation, University of Social Welfare and Rehabilitation Sciences, Tehran, Iran.
Authors' contributions
All authors contributed equally to the conception and design of the study, data collection and analysis, interception of the results, and manuscript drafting. Each author approved the submission of the final version of the manuscript.
Conflict of interest
The authors declared no conflict of interest.
Acknowledgments
We are deeply grateful to the students who participated in this study, without whom this research would not have been possible. Their willingness to participate and provide data has been invaluable for the success of this project.
References
- Gartha IV. What is biofeedback? Canadian Family Physician. 1976; 22:105-6. [PMID]
- Koleini Mamaghani N, Mosaddad SH, Saffar Dezfuli M. Assessment of Muscular Activity by Mechanomyogram (MMG). Iran Occupational Health. 2006; 3(2):4. [Link]
- Nazari M. [Neurofeedback: Examining challenges, positive and negative opinions and making suggestions (Persian)]. Paper presented at: Conference: Iranian Neuropsychology Symposium. 2010; Alboez, Iran. [Link]
- Schwartz MS, Andrasik F, editors. Biofeedback: A practitioner's guide. New York: Guilford Publications; 2017. [Link]
- Pourmomeni A, Hassan Emami M, Amooshahi M, Adibi P. [Comparing biofeedback therapy and balloon defecation training in treatment of dyssynergic defecation (Persian)]. Journal of Isfahan Medical School. 2010; 28(105). [Link]
- Janssen J, Verschuren O, Renger WJ, Ermers J, Ketelaar M, van Ee R. Gamification in Physical Therapy: More Than Using Games. Pediatric Physical Therapy. 2017; 29(1):95-9. [DOI:10.1097/PEP.0000000000000326] [PMID]
- Kardan A, Taghavi M . [A strategy to increase participation in e-learning based on gamification(Persian). Paper presented at: 3rd International Conference on Web Research. 19 April 2017; Tehran, Iran. [Link]
- Hamari J, Koivisto J, Sarsa H. Does gamification work?--A literature review of empirical studies on gamification. Paper presented at: 2014 47th Hawaii International Conference on System Sciences. Waikoloa, HI, USA, 06-09 January 2014. [DOI:10.1109/HICSS.2014.377]
- van der Kooij K, van Dijsseldonk R, van Veen M, Steenbrink F, de Weerd C, Overvliet KE. Gamification as a Sustainable Source of Enjoyment During Balance and Gait Exercises. Frontiers in Psychology. 2019; 10:294. [DOI:10.3389/fpsyg.2019.00294] [PMID]
- de Montalivet E, Bailly K, Touillet A, Martinet N, Paysant J, Jarrasse N. Guiding the Training of Users With a Pattern Similarity Biofeedback to Improve the Performance of Myoelectric Pattern Recognition. IEEE Transactions on Neural Systems and Rehabilitation Engineering. 2020; 28(8):1731-41. [DOI:10.1109/TNSRE.2020.3003077] [PMID]
- Frank DL, Khorshid L, Kiffer JF, Moravec CS, McKee MG. Biofeedback in medicine: Who, when, why and how? Mental Health in Family Medicine. 2010; 7(2):85-91. [PMID]
- Hinton EH, Buffum R, Stergiou N, Kingston D, Bierner S, Knarr BA. A portable visual biofeedback device can accurately measure and improve hip extension angle in individuals post-stroke. Clinical Biomechanics (Bristol). 2023; 105:105967. [DOI:10.1016/j.clinbiomech.2023.105967] [PMID]
- Barandas M, Gamboa H, Fonseca J. A real time biofeedback system using visual user interface for physical rehabilitation. Procedia Manufacturing. 2015; 3:823-8. [DOI:10.1016/j.promfg.2015.07.337]
- Najafi Z, Rezaeitalab F, Yaghubi M, Manzari ZS. The effect of biofeedback on the motor- muscular situation in rehabilitation of stroke patients: A randomized controlled trial. Journal of Caring Sciences. 2018; 7(2):89-93. [DOI:10.15171/jcs.2018.014] [PMID]
- Hübner L, Voelcker-Rehage C. Does physical activity benefit motor performance and learning of upper extremity tasks in older adults? - A systematic review. European Review of Aging and Physical Activity . 2017; 14:15. [DOI:10.1186/s11556-017-0181-7] [PMID]
- Marin-Pardo O, Donnelly MR, Phanord CS, Wong K, Liew SL. Improvements in motor control are associated with improved quality of life following an at-home muscle biofeedback program for chronic stroke. Frontiers in Human Neuroscience. 2024; 18:1356052. [DOI:10.3389/fnhum.2024.1356052] [PMID]
- Faucett J, Garry M, Nadler D, Ettare D. A test of two training interventions to prevent work-related musculoskeletal disorders of the upper extremity. Applied Ergonomics. 2002; 33(4):337-47. [DOI:10.1016/S0003-6870(02)00006-6] [PMID]
- Beach PS, Perreault M, Brian A, Collier DH. Motor learning and development. Champaign: Human kinetics; 2023. [Link]
- Meng HJ, Zhang LL, Luo SS, Cao N, Zhang J, Pi YL. Modulation of hand motor skill performance induced by motor practice combined with matched or mismatched hand posture motor imagery. Physiology & Behavior. 2020; 225:113084. [DOI:10.1016/j.physbeh.2020.113084] [PMID]
- Xicoy H, Vila M, Laguna A. Systems Medicine in Parkinson׳ s Disease: Joining Efforts to Change History. Systems Medicine Integrative, Qualitative and Computational Approaches. 2021; 2:1-14. [DOI:10.1016/B978-0-12-801238-3.11612-5]
- Florjanski W, Malysa A, Orzeszek S, Smardz J, Olchowy A, Paradowska-Stolarz A, et al. Evaluation of biofeedback usefulness in masticatory muscle activity management-A systematic review. Journal of Clinical Medicine. 2019; 8(6):766. [DOI:10.3390/jcm8060766] [PMID]
- Lind CM. A rapid review on the effectiveness and use of wearable biofeedback motion capture systems in ergonomics to mitigate adverse postures and movements of the upper body. Sensors. 2024; 24(11):3345. [DOI:10.3390/s24113345] [PMID] [PMCID]
- Yu B, Funk M, Hu J, Wang Q, Feijs L. Biofeedback for everyday stress management: A systematic review. Frontiers in ICT. 2018; 5:23. [DOI:10.3389/fict.2018.00023]
- Shumway-Cook A, Woollacott MH. Motor control: Translating research into clinical practice. Philadelphia: Lippincoot Williams & Wilkins; 2007. [Link]
- O'Sullivan SB, Schmitz TJ, Fulk G. Physical rehabilitation. Boston: F.A. Davis Company; 2019. [Link]
Type of Study: Research |
Subject:
General
Received: 2024/07/23 | Accepted: 2024/10/23 | Published: 2025/04/1
Received: 2024/07/23 | Accepted: 2024/10/23 | Published: 2025/04/1
Send email to the article author
| Rights and permissions | |
 |
This work is licensed under a Creative Commons Attribution-NonCommercial 4.0 International License. |
This is an open access article distributed under the terms of the Creative Commons Attribution License (CC-By-NC), which permits use, distribution, and reproduction in any medium, provided the original work is properly cited and is not used for commercial purposes.
Contact Information