Thu, Jul 30, 2026
Volume 15, Issue 3 (Summer 2025)
PTJ 2025, 15(3): 175-182 |
Back to browse issues page


Download citation:
BibTeX | RIS | EndNote | Medlars | ProCite | Reference Manager | RefWorks
Send citation to:


BibTeX | RIS | EndNote | Medlars | ProCite | Reference Manager | RefWorks
Send citation to:
Jafarnezhadgero A, Moradzadeh N, Fakhri Mirzang E. Effect of Overweight and Fatigue on Ankle Directed and General Co-contraction During Running. PTJ 2025; 15 (3) :175-182
URL: http://ptj.uswr.ac.ir/article-1-650-en.html
URL: http://ptj.uswr.ac.ir/article-1-650-en.html


1- Department of Sport Management and Biomechanics, Faculty of Education Sciences and Psychology, University of Mohaghegh Ardabili, Ardabil, Iran.
2- Department of Physical Education and Sport Sciences, Faculty of Education Sciences and Psychology, University of Mohaghegh Ardabili, Ardabil, Iran.
2- Department of Physical Education and Sport Sciences, Faculty of Education Sciences and Psychology, University of Mohaghegh Ardabili, Ardabil, Iran.
Full-Text [PDF 520 kb]
(655 Downloads)
| Abstract (HTML) (2888 Views)
Full-Text: (571 Views)
Introduction
Obesity is one of the important factors that can lead to running-related injuries [1]. However, most people who suffer from this condition have started recreational activities, such as running in order to decrease weight and improve cardiovascular and metabolic health [2, 3]. Currently, it is not precisely known whether running leads to an increased risk of orthopedic injuries in overweight people due to high mechanical pressures on the musculoskeletal system or not. It has been reported that excessive weight changes the biomechanics of the ankle joints, especially in the rear foot, which ultimately leads to flat feet and a lack of stability in the body during dynamic activities [2]. Furthermore, it has been observed that 25% of overweight runners, compared to 15% of normal-weight runners, suffer from running-related injuries [1].
Pronated feet are one of the important factors that lead to lower limb injuries during running [4, 5]. A pronated foot is characterized by a decrease in the middle longitudinal arch during weight bearing, which is resolved in non-weight-bearing conditions. The prevalence of excessive foot pronation is from 48% to 78% in young people [6] and about 2-23% in adults [7]. Excessive foot pronation is also common in overweight adults [8, 9]. Overweight individuals are said to experience more problems with pronation than normal-weight adults [10-12]. Despite this, limited data shows a relationship between overweight people with pronated feet and injuries caused by running. For example, Jafarnezhadgero et al. investigated the effect of excessive body weight along with pronated feet on kinetic variables during running. Excessive body weight affects the ground reaction force variables during running [13-15]. Also, the findings indicated that there was a rise in medio-lateral forces while running during the stance phase. It appears that people who have extra weight and flat feet employ a specific technique to decrease the vertical impact while running [16]. Irving et al. reported that obesity and pronated feet are associated with chronic pain in the heel and may be important factors contributing to running-related injuries [17]. Vincent et al. conducted a study on how body mass index (BMI) impacts the biomechanical variables of recreational runners while they run. The results showed that overweight athletes exhibited a higher loading rate than normal-weight athletes by increasing stiffness in the lower limbs and limiting the amount of vertical displacement [18].
Preventing and delaying fatigue is one of the most effective factors in competitive sports [19]. Other factors, such as the different types of muscle fiber composition in overweight individuals can be effective in the occurrence of fatigue [20, 21]. It has been reported that the ratio of fast-twitch fibers (higher fatigue resistance) compared to slow-twitch fibers (resistant to fatigue) is higher in overweight people [22]. Mehta et al. reported a 32% decrease in muscle endurance of overweight people compared to people with normal weight during maximal contraction [23]. Several studies have reported greater electromyography (EMG) activity of knee joint muscles [23-25] in people with knee osteoarthritis compared to healthy people. Since EMG activity provides information about injuries caused by running [26, 27], the biomechanical components yield crucial parameters for identifying and understanding the causes of injury in overweight individuals. Thus, the present study aimed to determine the interactive effect of fatigue and overweight on the general and directional co-contraction of the ankle joint while running.
Materials and Methods
This clinical trial was conducted in 2023 in Ardabil City. The number of samples was determined using G*Power software. The calculation parameters included a significance level of 0.05 (type I error) and a type II error equal to 0.05. Also, utilizing a pre-test and post-test design and considering a correlation coefficient of 0.5 and an effect size of 0.8 using a two-way analysis of variance, at least 40 people were required to participate in the present study [28, 29]. As a result, the statistical sample of the present study included 48 females who were divided into four groups. The first group included individuals with a normal BMI (e.g. 20≤ BMI <25 kg/m2) and normal foot (e.g. 4< navicular drop <10 mm, foot posture index between 0 and 6). The second group included individuals with normal BMI and pronated feet (e.g. 19> navicular drop>10 mm, 12≥ foot posture index >10). The third group included individuals who were overweight/obese (e.g. 35≥ BMI ≥25 kg/m2) with normal feet. The fourth group included overweight individuals. The foot posture index is described in detail elsewhere [12, 13].
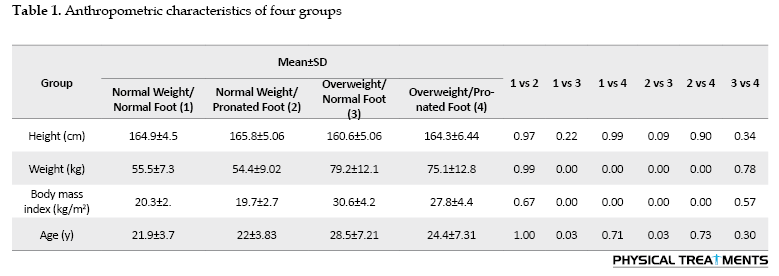
The characteristics of the groups are depicted in Table 1. All participants were right-footed and their superior foot was determined by the ball kick test. An orthopedic doctor evaluated the anthropometric characteristics of all participants before the study. Those without any symptoms of musculoskeletal or neurological disorders were placed in the first group. The difference in the drop of the navicular bone was used to diagnose the pronation of the subjects. Each subject was asked to sit on a chair and place their foot in a weightless position. In this position, the distance between the prominence of the navicular bone and the surface of the ground was measured. Then, the subjects were asked to stand and distribute their weight equally on both legs. At this point, the height from the navicular bone to the sole was measured. If the difference between the two measurements was 5-10 mm, the person was classified as having a normal foot; if the difference was greater than 10 mm, the person was classified as having a pronated foot [12, 13]. The absence of orthopedic injuries, heart disease, respiratory issues, and the duration of the test protocols were among the criteria for inclusion in the study. The following exclusion criteria applied to all groups: A history of surgical procedures on the musculoskeletal system related to the torso and/or lower extremities, cardiorespiratory or neuromuscular conditions, orthopedic issues, and lower limb length discrepancies exceeding 5 mm. Also, ethical research standards were followed at all stages, and consent was obtained from the participants to participate in the study. All aspects of the research implementation are in line with the principles of the Declaration of Helsinki.
During the test session, the participants first performed 4 minutes of dynamic stretching and 5 minutes of warm-up in the form of light running (10-11 on the Borg scale of 6-20 points). Participants were instructed to run at a consistent speed of approximately 3.3 m/s using comparable running shoes both before and after the fatigue protocol (with 5% variability). A force plate was embedded in an 18-meter-long walkway above the ground. The average speed of running was calculated by dividing the distance covered during running (i.e. 18 m) by the time taken for running, which was measured using a chronometer. Participants were instructed to ideally land with their dominant foot in the middle of the force plate [14] to reduce the chances of exceeding the boundaries of the force platform.
Fatigue protocol
The fatigue protocol was performed using an advanced model treadmill (Horizon Fitness, Omega GT, USA) without incline. In the beginning, the subjects began the protocol while walking at a speed of 6 km/h, with the treadmill speed increasing by 1 km per hour every 2 minutes. The Borg perception scale was used to determine the final moment of fatigue of the participants. Once the participants indicated a perception score of 13 or more on the Borg scale, the treadmill speed was adjusted to facilitate steady-state running. The fatigue protocol finished after maintaining a steady-state running pace above 17 on the Borg scale or reaching 80% of the maximum heart rate for two minutes [30]. Immediately after the fatigue protocol, the subjects were asked to perform the running protocol again at a specified speed, completing 6 repetitions of running while muscle activity was recorded. During the running trial, EMG patterns were captured with bipolar Ag/AgCl surface electrodes that were placed parallel to the direction of the muscle fibers, maintaining a distance of 20 mm between the electrodes. Rigorous skin preparation was executed to ensure that skin impedance remained at or below 5000 Ω. The EMG system (Data LITE EMG, Biometrics Ltd, England) recorded the EMG data at a frequency of 1000 Hz with great precision, with great precision, demonstrating a validity of 0.91 and a reliability of 0.95 [31].
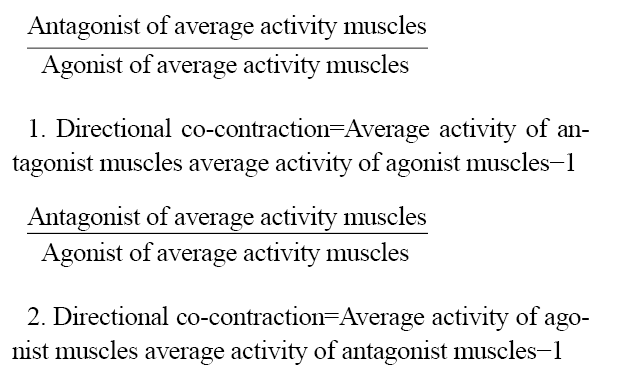
The method of electrode placement was bipolar, and the distance between the centers of both electrodes was 20 mm. The electrodes were attached along the muscle fibers after the identification of the landmarks [32]. Based on the protocol (surface EMG for the non-invasive Assessment of Muscles), surface electrodes were installed to record electrical signals from the selected muscles: Tibialis anterior (TA), gastrocnemius medialis (Gas-M), vastus lateralis (VL), vastus medialis (VM), rectus femoris (RF), biceps femoris (BF), and semitendinosus (ST) [33]. Surface EMG signals were recorded at 1000 Hz and smoothed using a 10-500 Hz low-pass filter. The EMG signals were recorded with a portable Wi-Fi transmission device at a 1000 Hz analog-to-digital conversion rate and 16-bit resolution, with an amplitude range of ±5 V. The signals were band-pass filtered within the range of 10 to 500 Hz and had an input impedance greater than 10 Ω. Additionally, the common mode-rejection ratio was greater than 110 dB. The run was divided into two phases to analyze the EMG data: The first half (0‒50% stance phase) and the second half (50‒100% stance phase) of the stance phase. To normalize the data, the information for each muscle was divided by the MVIC of that muscle and then multiplied by a hundred. The following relations were used to determine the values of both directional co-contraction and general co-contraction in different phases of running (Equations 1 and 2) [15]:
Statistical analysis
The running variables extracted were averaged for each participant across six trials. The values are shown as Mean±SD. Confirmation of the normal distribution of data was carried out using the Shapiro-Wilk test. Custom-made scripts were utilized for all analyses (Matlab R2022a, MathWorks, Natick, USA). A separate two-way ANOVA with repeated measures was used to calculate the primary impacts of body mass (normal weight and overweight) and foot pronation (normal foot and pronated foot) for each dependent vareiable. Eta squared was used to estimate the effect sizes (0.01<η²≤0.06: Small effect size (ES); 0.06>η²<0.14=moderate effect size; η² ≥0.14: High effect size). The level of significance was established at P<0.05. All analyses were performed using SPSS software, version 23.
Results
The anthropometric characteristics of the four groups are shown in Table 1.
The findings indicated that there were noticeable primary effects of “group” on the overall co-contraction of the ankle joint during the loading phase (P=0.043, ƞ2=0.168). Pairwise comparisons demonstrated significantly greater general co-contraction of the ankle joint in the overweight/normal foot group compared to the other groups (Table 2).
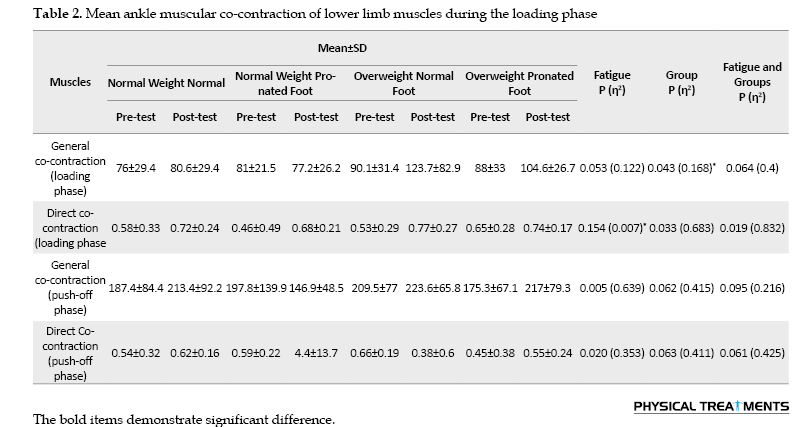
During the loading phase, significant main effects of “fatigue” were observed for the directed co-contraction of the ankle joint (P=0.007, ƞ2=0.154). Directional co-contraction of the ankle joint during the loading phase decreased at the post-test compared with the pre-test (Table 2).
No significant group-by-fatigue interactions were found for general and directed co-contraction of the muscles of the ankle joint during the loading and push-off phases (P>0.05) (Table 2).
Discussion
The present study aimed to determine the impact of having pronated feet and being overweight on the general and directional co-contraction of the ankle joint in women under a fatigue protocol. A statistically significant influence of the group factor was observed on the general co-contraction values of the ankle joint during the loading response phase. The post hoc test results indicated that the general co-contraction values of the ankle joint during the loading response phase are higher in the overweight group than in the normal weight group.
It has been reported that increasing general co-contraction results in higher loads on the knee joint. Since directional contraction provides the greatest effect in reducing the loads on the joint by preventing the condyles of the knee joint from separating [15], the effect can also be elicited by general co-contraction. However, because it is not directional, general co-contraction is ineffective in preventing the condyles from lifting and may irrationally increase all joint loads [15, 34]. Maktouf et al. reported that obesity leads to an increase in the co-contraction of the soleus muscle and the TA muscle in the ankle joint in young people, in order to reduce the mobility limitations associated with obesity and adjust the appropriate movement posture to cope [35]. The function of the agonist muscle may be reduced, and stiffness in the joint may increase due to high levels of co-contraction, ultimately resulting in further fatigue. For these reasons, the rise in muscle co-contraction should not be viewed as a positive adjustment due to its correlation with adverse outcomes that may impact an individual’s other daily tasks. Also, Tomlinson et al. examined the simultaneous contraction of the muscles around the ankle joint during the maximal isometric contraction in overweight adults, with findings indicating that muscle co-contraction during contraction is not impacted by obesity [36].
However, the demographic characteristics and the protocol implemented in these studies are different from the current research. Co-contraction is one of the possible factors for movement disorders with fatigue [37]. Also, in line with the unbiasedness of the results, we can refer to the study by Jafarnezhadgero et al., who reported a reduction in the co-contraction of the ankle joint in people with excessive pronation. The current study’s findings indicated the statistically significant impact of fatigue on the directional co-contraction values of the ankle joint during the loading response phase. Pairwise comparisons showed a significant increase in the directional co-contraction of the ankle joint during the loading response phase in the post-test compared to the pre-test in all groups. Also, the highest co-contraction was observed in the overweight/pronates group in the post-test compared to the pre-test. The co-contraction of the antagonist and agonist muscles in the inner part of the knee joint results in directional changes in activity, supporting the abducting moment, while the contraction of the antagonist and agonist muscles on the outer part of this joint supports the adducting moment. It has also been reported that directional co-contraction directly supports the external moment of this joint to prevent joint condyle separation and reduce the loads on the joint [15].
The results of the present study align with reports indicating that a reduction in muscle co-contraction during prolonged contractions results in an elevated fatigue failure point. The reduction in muscle co-contraction is a crucial element in reducing joint stability and steadiness. The increase in muscle co-contraction leads to the loss of productive energy and is finally one of the factors involved in causing fatigue [38-41]. It seems that the decrease in the amount of energy produced is one of the reasons for the increase in co-contraction after the fatigue protocol in the overweight/pronate foot group. Reportedly, an increase in co-contraction in the ankle joint results in enhanced stability and movement control, leading to heightened joint stiffness [42, 43]. While other studies have reported a direct relationship between increased joint co-contraction and decreased stability and movement control, this issue can be discussed from several perspectives. First, the activity of large and strong muscles is directly related to the increase in energy consumption. As a result, it leads to fatigue in the person and reduces stability in the joint [44]. Secondly, the increase in co-contraction in the joint leads to movement restriction during dynamic activities [44]. Only women were present in the current study, which was one of the limitations of the study; thus, it is not possible to generalize the results to men. Also, limitations related to electrode placement prevented the recording of activity in certain muscles of the lower and upper limbs, which should be investigated in future studies. Furthermore, the lack of registration of kinematic variables was another limitation of the present study.
Conclusion
The general co-contraction values of the ankle joint were higher in overweight individuals than in those of normal weight, which may be associated with increased loads on the ankle joint. Our findings can be useful for designing rehabilitation protocols for overweight people with pronation or for those experiencing both conditions.
Ethical Considerations
Compliance with ethical guidelines
The Helsinki Ethics Statement was followed in conducting the current study, and the study protocol was approved by the Ethics Committee of the University of Mohaghegh Ardabili, Ardabil, Iran (Code: IR.UMA.REC.1402.011). Participants entered the study after completing the written informed consent form and had the option to withdraw from the research at any time.
Funding
This research did not receive any grant from funding agencies in the public, commercial, or non-profit sectors.
Authors' contributions
This article was prepared with equal contributions from all authors.
Conflict of interest
The authors declared no conflict of interest.
Acknowledgments
The authors appreciate all the participants in the research
References
Obesity is one of the important factors that can lead to running-related injuries [1]. However, most people who suffer from this condition have started recreational activities, such as running in order to decrease weight and improve cardiovascular and metabolic health [2, 3]. Currently, it is not precisely known whether running leads to an increased risk of orthopedic injuries in overweight people due to high mechanical pressures on the musculoskeletal system or not. It has been reported that excessive weight changes the biomechanics of the ankle joints, especially in the rear foot, which ultimately leads to flat feet and a lack of stability in the body during dynamic activities [2]. Furthermore, it has been observed that 25% of overweight runners, compared to 15% of normal-weight runners, suffer from running-related injuries [1].
Pronated feet are one of the important factors that lead to lower limb injuries during running [4, 5]. A pronated foot is characterized by a decrease in the middle longitudinal arch during weight bearing, which is resolved in non-weight-bearing conditions. The prevalence of excessive foot pronation is from 48% to 78% in young people [6] and about 2-23% in adults [7]. Excessive foot pronation is also common in overweight adults [8, 9]. Overweight individuals are said to experience more problems with pronation than normal-weight adults [10-12]. Despite this, limited data shows a relationship between overweight people with pronated feet and injuries caused by running. For example, Jafarnezhadgero et al. investigated the effect of excessive body weight along with pronated feet on kinetic variables during running. Excessive body weight affects the ground reaction force variables during running [13-15]. Also, the findings indicated that there was a rise in medio-lateral forces while running during the stance phase. It appears that people who have extra weight and flat feet employ a specific technique to decrease the vertical impact while running [16]. Irving et al. reported that obesity and pronated feet are associated with chronic pain in the heel and may be important factors contributing to running-related injuries [17]. Vincent et al. conducted a study on how body mass index (BMI) impacts the biomechanical variables of recreational runners while they run. The results showed that overweight athletes exhibited a higher loading rate than normal-weight athletes by increasing stiffness in the lower limbs and limiting the amount of vertical displacement [18].
Preventing and delaying fatigue is one of the most effective factors in competitive sports [19]. Other factors, such as the different types of muscle fiber composition in overweight individuals can be effective in the occurrence of fatigue [20, 21]. It has been reported that the ratio of fast-twitch fibers (higher fatigue resistance) compared to slow-twitch fibers (resistant to fatigue) is higher in overweight people [22]. Mehta et al. reported a 32% decrease in muscle endurance of overweight people compared to people with normal weight during maximal contraction [23]. Several studies have reported greater electromyography (EMG) activity of knee joint muscles [23-25] in people with knee osteoarthritis compared to healthy people. Since EMG activity provides information about injuries caused by running [26, 27], the biomechanical components yield crucial parameters for identifying and understanding the causes of injury in overweight individuals. Thus, the present study aimed to determine the interactive effect of fatigue and overweight on the general and directional co-contraction of the ankle joint while running.
Materials and Methods
This clinical trial was conducted in 2023 in Ardabil City. The number of samples was determined using G*Power software. The calculation parameters included a significance level of 0.05 (type I error) and a type II error equal to 0.05. Also, utilizing a pre-test and post-test design and considering a correlation coefficient of 0.5 and an effect size of 0.8 using a two-way analysis of variance, at least 40 people were required to participate in the present study [28, 29]. As a result, the statistical sample of the present study included 48 females who were divided into four groups. The first group included individuals with a normal BMI (e.g. 20≤ BMI <25 kg/m2) and normal foot (e.g. 4< navicular drop <10 mm, foot posture index between 0 and 6). The second group included individuals with normal BMI and pronated feet (e.g. 19> navicular drop>10 mm, 12≥ foot posture index >10). The third group included individuals who were overweight/obese (e.g. 35≥ BMI ≥25 kg/m2) with normal feet. The fourth group included overweight individuals. The foot posture index is described in detail elsewhere [12, 13].
The characteristics of the groups are depicted in Table 1. All participants were right-footed and their superior foot was determined by the ball kick test. An orthopedic doctor evaluated the anthropometric characteristics of all participants before the study. Those without any symptoms of musculoskeletal or neurological disorders were placed in the first group. The difference in the drop of the navicular bone was used to diagnose the pronation of the subjects. Each subject was asked to sit on a chair and place their foot in a weightless position. In this position, the distance between the prominence of the navicular bone and the surface of the ground was measured. Then, the subjects were asked to stand and distribute their weight equally on both legs. At this point, the height from the navicular bone to the sole was measured. If the difference between the two measurements was 5-10 mm, the person was classified as having a normal foot; if the difference was greater than 10 mm, the person was classified as having a pronated foot [12, 13]. The absence of orthopedic injuries, heart disease, respiratory issues, and the duration of the test protocols were among the criteria for inclusion in the study. The following exclusion criteria applied to all groups: A history of surgical procedures on the musculoskeletal system related to the torso and/or lower extremities, cardiorespiratory or neuromuscular conditions, orthopedic issues, and lower limb length discrepancies exceeding 5 mm. Also, ethical research standards were followed at all stages, and consent was obtained from the participants to participate in the study. All aspects of the research implementation are in line with the principles of the Declaration of Helsinki.
During the test session, the participants first performed 4 minutes of dynamic stretching and 5 minutes of warm-up in the form of light running (10-11 on the Borg scale of 6-20 points). Participants were instructed to run at a consistent speed of approximately 3.3 m/s using comparable running shoes both before and after the fatigue protocol (with 5% variability). A force plate was embedded in an 18-meter-long walkway above the ground. The average speed of running was calculated by dividing the distance covered during running (i.e. 18 m) by the time taken for running, which was measured using a chronometer. Participants were instructed to ideally land with their dominant foot in the middle of the force plate [14] to reduce the chances of exceeding the boundaries of the force platform.
Fatigue protocol
The fatigue protocol was performed using an advanced model treadmill (Horizon Fitness, Omega GT, USA) without incline. In the beginning, the subjects began the protocol while walking at a speed of 6 km/h, with the treadmill speed increasing by 1 km per hour every 2 minutes. The Borg perception scale was used to determine the final moment of fatigue of the participants. Once the participants indicated a perception score of 13 or more on the Borg scale, the treadmill speed was adjusted to facilitate steady-state running. The fatigue protocol finished after maintaining a steady-state running pace above 17 on the Borg scale or reaching 80% of the maximum heart rate for two minutes [30]. Immediately after the fatigue protocol, the subjects were asked to perform the running protocol again at a specified speed, completing 6 repetitions of running while muscle activity was recorded. During the running trial, EMG patterns were captured with bipolar Ag/AgCl surface electrodes that were placed parallel to the direction of the muscle fibers, maintaining a distance of 20 mm between the electrodes. Rigorous skin preparation was executed to ensure that skin impedance remained at or below 5000 Ω. The EMG system (Data LITE EMG, Biometrics Ltd, England) recorded the EMG data at a frequency of 1000 Hz with great precision, with great precision, demonstrating a validity of 0.91 and a reliability of 0.95 [31].
The method of electrode placement was bipolar, and the distance between the centers of both electrodes was 20 mm. The electrodes were attached along the muscle fibers after the identification of the landmarks [32]. Based on the protocol (surface EMG for the non-invasive Assessment of Muscles), surface electrodes were installed to record electrical signals from the selected muscles: Tibialis anterior (TA), gastrocnemius medialis (Gas-M), vastus lateralis (VL), vastus medialis (VM), rectus femoris (RF), biceps femoris (BF), and semitendinosus (ST) [33]. Surface EMG signals were recorded at 1000 Hz and smoothed using a 10-500 Hz low-pass filter. The EMG signals were recorded with a portable Wi-Fi transmission device at a 1000 Hz analog-to-digital conversion rate and 16-bit resolution, with an amplitude range of ±5 V. The signals were band-pass filtered within the range of 10 to 500 Hz and had an input impedance greater than 10 Ω. Additionally, the common mode-rejection ratio was greater than 110 dB. The run was divided into two phases to analyze the EMG data: The first half (0‒50% stance phase) and the second half (50‒100% stance phase) of the stance phase. To normalize the data, the information for each muscle was divided by the MVIC of that muscle and then multiplied by a hundred. The following relations were used to determine the values of both directional co-contraction and general co-contraction in different phases of running (Equations 1 and 2) [15]:
Statistical analysis
The running variables extracted were averaged for each participant across six trials. The values are shown as Mean±SD. Confirmation of the normal distribution of data was carried out using the Shapiro-Wilk test. Custom-made scripts were utilized for all analyses (Matlab R2022a, MathWorks, Natick, USA). A separate two-way ANOVA with repeated measures was used to calculate the primary impacts of body mass (normal weight and overweight) and foot pronation (normal foot and pronated foot) for each dependent vareiable. Eta squared was used to estimate the effect sizes (0.01<η²≤0.06: Small effect size (ES); 0.06>η²<0.14=moderate effect size; η² ≥0.14: High effect size). The level of significance was established at P<0.05. All analyses were performed using SPSS software, version 23.
Results
The anthropometric characteristics of the four groups are shown in Table 1.
The findings indicated that there were noticeable primary effects of “group” on the overall co-contraction of the ankle joint during the loading phase (P=0.043, ƞ2=0.168). Pairwise comparisons demonstrated significantly greater general co-contraction of the ankle joint in the overweight/normal foot group compared to the other groups (Table 2).
During the loading phase, significant main effects of “fatigue” were observed for the directed co-contraction of the ankle joint (P=0.007, ƞ2=0.154). Directional co-contraction of the ankle joint during the loading phase decreased at the post-test compared with the pre-test (Table 2).
No significant group-by-fatigue interactions were found for general and directed co-contraction of the muscles of the ankle joint during the loading and push-off phases (P>0.05) (Table 2).
Discussion
The present study aimed to determine the impact of having pronated feet and being overweight on the general and directional co-contraction of the ankle joint in women under a fatigue protocol. A statistically significant influence of the group factor was observed on the general co-contraction values of the ankle joint during the loading response phase. The post hoc test results indicated that the general co-contraction values of the ankle joint during the loading response phase are higher in the overweight group than in the normal weight group.
It has been reported that increasing general co-contraction results in higher loads on the knee joint. Since directional contraction provides the greatest effect in reducing the loads on the joint by preventing the condyles of the knee joint from separating [15], the effect can also be elicited by general co-contraction. However, because it is not directional, general co-contraction is ineffective in preventing the condyles from lifting and may irrationally increase all joint loads [15, 34]. Maktouf et al. reported that obesity leads to an increase in the co-contraction of the soleus muscle and the TA muscle in the ankle joint in young people, in order to reduce the mobility limitations associated with obesity and adjust the appropriate movement posture to cope [35]. The function of the agonist muscle may be reduced, and stiffness in the joint may increase due to high levels of co-contraction, ultimately resulting in further fatigue. For these reasons, the rise in muscle co-contraction should not be viewed as a positive adjustment due to its correlation with adverse outcomes that may impact an individual’s other daily tasks. Also, Tomlinson et al. examined the simultaneous contraction of the muscles around the ankle joint during the maximal isometric contraction in overweight adults, with findings indicating that muscle co-contraction during contraction is not impacted by obesity [36].
However, the demographic characteristics and the protocol implemented in these studies are different from the current research. Co-contraction is one of the possible factors for movement disorders with fatigue [37]. Also, in line with the unbiasedness of the results, we can refer to the study by Jafarnezhadgero et al., who reported a reduction in the co-contraction of the ankle joint in people with excessive pronation. The current study’s findings indicated the statistically significant impact of fatigue on the directional co-contraction values of the ankle joint during the loading response phase. Pairwise comparisons showed a significant increase in the directional co-contraction of the ankle joint during the loading response phase in the post-test compared to the pre-test in all groups. Also, the highest co-contraction was observed in the overweight/pronates group in the post-test compared to the pre-test. The co-contraction of the antagonist and agonist muscles in the inner part of the knee joint results in directional changes in activity, supporting the abducting moment, while the contraction of the antagonist and agonist muscles on the outer part of this joint supports the adducting moment. It has also been reported that directional co-contraction directly supports the external moment of this joint to prevent joint condyle separation and reduce the loads on the joint [15].
The results of the present study align with reports indicating that a reduction in muscle co-contraction during prolonged contractions results in an elevated fatigue failure point. The reduction in muscle co-contraction is a crucial element in reducing joint stability and steadiness. The increase in muscle co-contraction leads to the loss of productive energy and is finally one of the factors involved in causing fatigue [38-41]. It seems that the decrease in the amount of energy produced is one of the reasons for the increase in co-contraction after the fatigue protocol in the overweight/pronate foot group. Reportedly, an increase in co-contraction in the ankle joint results in enhanced stability and movement control, leading to heightened joint stiffness [42, 43]. While other studies have reported a direct relationship between increased joint co-contraction and decreased stability and movement control, this issue can be discussed from several perspectives. First, the activity of large and strong muscles is directly related to the increase in energy consumption. As a result, it leads to fatigue in the person and reduces stability in the joint [44]. Secondly, the increase in co-contraction in the joint leads to movement restriction during dynamic activities [44]. Only women were present in the current study, which was one of the limitations of the study; thus, it is not possible to generalize the results to men. Also, limitations related to electrode placement prevented the recording of activity in certain muscles of the lower and upper limbs, which should be investigated in future studies. Furthermore, the lack of registration of kinematic variables was another limitation of the present study.
Conclusion
The general co-contraction values of the ankle joint were higher in overweight individuals than in those of normal weight, which may be associated with increased loads on the ankle joint. Our findings can be useful for designing rehabilitation protocols for overweight people with pronation or for those experiencing both conditions.
Ethical Considerations
Compliance with ethical guidelines
The Helsinki Ethics Statement was followed in conducting the current study, and the study protocol was approved by the Ethics Committee of the University of Mohaghegh Ardabili, Ardabil, Iran (Code: IR.UMA.REC.1402.011). Participants entered the study after completing the written informed consent form and had the option to withdraw from the research at any time.
Funding
This research did not receive any grant from funding agencies in the public, commercial, or non-profit sectors.
Authors' contributions
This article was prepared with equal contributions from all authors.
Conflict of interest
The authors declared no conflict of interest.
Acknowledgments
The authors appreciate all the participants in the research
References
- Bertelsen ML, Hansen M, Rasmussen S, Nielsen RO. The start-to-run distance and running-related injury among obese novice runners: A randomized trial. International Journal of Sports Physical Therapy. 2018; 13(6):943-55. [DOI:10.26603/ijspt20180943] [PMID]
- Suciati T, Adnindya MR, Septadina IS, Pratiwi PP. Correlation between flat feet and body mass index in primary school students. Journal of Physics: Conference Series, IOP Publishing. 2019; 1246:012063. [DOI:10.1088/1742-6596/1246/1/012063]
- Buist I, Bredeweg SW. Higher risk of injury in overweight novice runners. British Journal of Sports Medicine. 2011; 45(4):338. [DOI:10.1136/bjsm.2011.084038.79]
- Behling AV, Manz S, von Tscharner V, Nigg BM. Pronation or foot movement - What is important. Journal of Science and Medicine in Sport. 2020; 23(4):366-71. [DOI:10.1016/j.jsams.2019.11.002] [PMID]
- Willems TM, Ley C, Goetghebeur E, Theisen D, Malisoux L. Motion-control shoes reduce the risk of pronation-related pathologies in recreational runners: A secondary analysis of a randomized controlled trial. The Journal of Orthopaedic and Sports Physical Therapy. 2021; 51(3):135-43. [DOI:10.2519/jospt.2021.9710] [PMID]
- Chen KC, Tung LC, Tung CH, Yeh CJ, Yang JF, Wang CH. An investigation of the factors affecting flatfoot in children with delayed motor development. Research in Developmental Disabilities. 2014; 35(3):639-45. [DOI:10.1016/j.ridd.2013.12.012] [PMID]
- Dunn JE, Link CL, Felson DT, Crincoli MG, Keysor JJ, McKinlay JB. Prevalence of foot and ankle conditions in a multiethnic community sample of older adults. American Journal of Epidemiology. 2004; 159(5):491-8. [DOI:10.1093/aje/kwh071] [PMID]
- Gonçalves de Carvalho BK, Penha PJ, Ramos NLJP, Andrade RM, Ribeiro AP, João SMA. Age, sex, body mass index, and laterality in the foot posture of adolescents: A cross sectional study. Journal of Manipulative and Physiological Therapeutics. 2020; 43(7):744-52. [DOI:10.1016/j.jmpt.2018.11.035] [PMID]
- Unver B, Selici K, Akbas E, Erdem EU. Foot posture, muscle strength, range of motion, and plantar sensation in overweight and obese. Journal of Applied Biomechanics. 2021; 37(2):87-94. [DOI:10.1123/jab.2020-0119] [PMID]
- Bali NK, Raghav D, Dwivedi A. Correlation between bmi and static biomechanical lower extremity kinetic chain variables in overweight young adults: A cross-sectional study. Journal of Clinical & Diagnostic Research. 2023; 17(5):YC01-6. [DOI:10.7860/JCDR/2023/60818.17884]
- Ghait AS, Mohamed EA, Abogazya AA, Behiry MA. The effect of obesity on the magnitude of quadriceps angle and angle of foot progression in adult females. World. 2020; 15(1):1-6. [Link]
- Redmond AC, Crosbie J, Ouvrier RA. Development and validation of a novel rating system for scoring standing foot posture: The Foot Posture Index. Clinical Biomechanics. 2006; 21(1):89-98. [DOI:10.1016/j.clinbiomech.2005.08.002] [PMID]
- Gijon-Nogueron G, Sanchez-Rodriguez R, Lopezosa-Reca E, Cervera-Marin JA, Martinez-Quintana R, Martinez-Nova A. Normal values of the foot posture index in a young adult spanish population: A cross-sectional study. Journal of the American Podiatric Medical Association. 2015; 105(1):42-6. [DOI:10.7547/8750-7315-105.1.42] [PMID]
- Jafarnezhadgero AA, Sorkhe E, Oliveira AS. Motion-control shoes help maintaining low loading rate levels during fatiguing running in pronated female runners. Gait & Posture. 2019; 73:65-70. [DOI:10.1016/j.gaitpost.2019.07.133] [PMID]
- Heiden TL, Lloyd DG, Ackland TR. Knee joint kinematics, kinetics and muscle co-contraction in knee osteoarthritis patient gait. Clinical Biomechanics. 2009; 24(10):833-41. [DOI:10.1016/j.clinbiomech.2009.08.005] [PMID]
- Jafarnezhadgero AA, Jahangirpour A, Parsa H, Sajedi H, Granacher U, Souza Oliveira A. The impact of excessive body weight and foot pronation on running kinetics: A cross-sectional study. Sports Medicine-Open. 2023; 9(1):116. [DOI:10.1186/s40798-023-00663-8] [PMID]
- Irving DB, Cook JL, Young MA, Menz HB. Obesity and pronated foot type may increase the risk of chronic plantar heel pain: A matched case-control study. BMC Musculoskelet Disord. 2007; 8:41. [DOI:10.1186/1471-2474-8-41] [PMID]
- Vincent HK, Kilgore JE 3rd, Chen C, Bruner M, Horodyski M, Vincent KR. Impact of Body Mass Index on Biomechanics of Recreational Runners. PM & R. 2020; 12(11):1106-12.[DOI:10.1002/pmrj.12335] [PMID]
- Jacobs BL, Azmitia EC. Structure and function of the brain serotonin system. Physiological reviews. 1992; 72(1):165-229. [DOI:10.1152/physrev.1992.72.1.165] [PMID]
- Hickey MS, Carey JO, Azevedo JL, Houmard JA, Pories WJ, Israel RG, et al. Skeletal muscle fiber composition is related to adiposity and in vitro glucose transport rate in humans. The American journal of physiology. 1995; 268(3 Pt 1):E453-7. [DOI:10.1152/ajpendo.1995.268.3.E453] [PMID]
- Hicks AL, Kent-Braun J, Ditor DS. Sex differences in human skeletal muscle fatigue. Exercise and sport sciences reviews. 2001; 29(3):109-12. [DOI:10.1097/00003677-200107000-00004] [PMID]
- Kriketos AD, Baur LA, O'Connor J, Carey D, King S, Caterson ID, Storlien LH. Muscle fibre type composition in infant and adult populations and relationships with obesity. International Journal of Obesity and Related Metabolic Disorders. 1997; 21(9):796-801. [DOI:10.1038/sj.ijo.0800476] [PMID]
- Mehta RK. Impacts of obesity and stress on neuromuscular fatigue development and associated heart rate variability. International Journal of Obesity. 2015; 39(2):208-13. [DOI:10.1038/ijo.2014.127] [PMID]
- Hodges PW, van den Hoorn W, Wrigley TV, Hinman RS, Bowles KA, Cicuttini F, et al. Increased duration of co-contraction of medial knee muscles is associated with greater progression of knee osteoarthritis. Manual Therapy. 2016; 21:151-8. [DOI:10.1016/j.math.2015.07.004] [PMID]
- Dixon PC, Gomes S, Preuss RA, Robbins SM. Muscular co-contraction is related to varus thrust in patients with knee osteoarthritis. Clinical Biomechanics. 2018; 60:164-9. [DOI:10.1016/j.clinbiomech.2018.10.021] [PMID]
- Pourrahim Ghouroghchi A, Jafarnezhadgero A, Abdollahpour Darvishani M. Determination of selected lower limb muscles electromyography frequency spectrum in male soccer players with ACL injury during three running patterns. Journal of Advanced Sport Technology. 2022; 6(2):1-9. [DOI:10.22098/jast.2022.1875]
- Suskens JJ, Tol JL, Kerkhoffs GM, Maas H, van Dieën JH, Reurink G. Activity distribution among the hamstring muscles during high‐speed running: A descriptive multichannel surface EMG study. Scandinavian Journal of Medicine & Science in Sports. 2023; 33(6):954-65. [DOI:10.1111/sms.14326] [PMID]
- Jafarnezhadgero AA, Dehghani M, Abdollahpourdarvishani M, Sheikhalizadeh H, Akrami M. Effect of textured foot orthoses on walking plantar pressure variables in children with autism spectrum disorders. Journal of Biomechanics. 2021; 129:110775. [DOI:10.1016/j.jbiomech.2021.110775] [PMID]
- Kinakin K. Optimal muscle training. Champaign: Human Kinetics; 2009. [Link]
- Koblbauer IF, van Schooten KS, Verhagen EA, van Dieën JH. Kinematic changes during running-induced fatigue and relations with core endurance in novice runners. Journal of Science and Medicine in Sport. 2014; 17(4):419-24. [DOI:10.1016/j.jsams.2013.05.013] [PMID]
- He J, Jiang N. Biometric from surface electromyogram (sEMG): Feasibility of user verification and identification based on gesture recognition. Frontiers in Bioengineering and Biotechnology. 2020; 8:58. [DOI:10.3389/fbioe.2020.00058] [PMID]
- Hermens HJ, Freriks B, Disselhorst-Klug C, Rau G. Development of recommendations for SEMG sensors and sensor placement procedures. Journal of Electromyography and Kinesiology. 2000; 10(5):361-74. [DOI:10.1016/S1050-6411(00)00027-4] [PMID]
- Hermens HJ, Freriks B, Merletti R, Stegeman D, Blok J, Rau G, et al. European recommendations for surface electromyography. Roessingh Research and Development. 1999; 8(2):13-54. [Link]
- Andriacchi TP. Dynamics of knee malalignment. The Orthopedic Clinics of North America. 1994; 25(3):395-403. [DOI:10.1016/S0030-5898(20)31924-6] [PMID]
- Maktouf W, Boyas S, Beaune B, Durand S. Differences in lower extremity muscular coactivation during postural control between healthy and obese adults. Gait & Posture. 2020; 81:197-204. [DOI:10.1016/j.gaitpost.2020.07.068] [PMID]
- Tomlinson DJ, Erskine RM, Morse CI, Winwood K, Onambélé-Pearson GL. Combined effects of body composition and ageing on joint torque, muscle activation and co-contraction in sedentary women. Age. 2014; 36(3):9652. [DOI:10.1007/s11357-014-9652-1] [PMID]
- Missenard O, Mottet D, Perrey S. The role of cocontraction in the impairment of movement accuracy with fatigue. Experimental Brain Research. 2008; 185(1):151-6. [DOI:10.1007/s00221-007-1264-x] [PMID]
- Fatollahi A, Jafarnezhadgero A, Amirzade N. Effect of walking on sand on co-Contraction of the lower limb muscles in individuals with overpronated foot. Medical Journal of Tabriz University of Medical Sciences and Health Services. 2021; 43(1):152-9. [DOI:10.34172/mj.2021.040]
- Psek JA, Cafarelli E. Behavior of coactive muscles during fatigue Journal of Applied Physiology. 1993; 74(1):170-5. [DOI:10.1152/jappl.1993.74.1.170] [PMID]
- Ebenbichler GR, Kollmitzer J, Glöckler L, Bochdansky T, Kopf A, Fialka V. The role of the biarticular agonist and cocontracting antagonist pair in isometric muscle fatigue. Muscle & Nerve. 1998; 21(12):1706-13. [DOI:10.1002/(SICI)1097-4598(199812)21:12<1706::AID-MUS13>3.0.CO;2-C]
- Lévénez M, Kotzamanidis C, Carpentier A, Duchateau J. Spinal reflexes and coactivation of ankle muscles during a submaximal fatiguing contraction. Journal of Applied Physiology. 2005; 99(3):1182-8. [DOI:10.1152/japplphysiol.00284.2005] [PMID]
- Iwamoto Y, Takahashi M, Shinkoda K. Differences of muscle co-contraction of the ankle joint between young and elderly adults during dynamic postural control at different speeds. Journal of Physiological Anthropology. 2017; 36(1):32. [DOI:10.1186/s40101-017-0149-3] [PMID]
- Cattagni T, Scaglioni G, Laroche D, Gremeaux V, Martin A. The involvement of ankle muscles in maintaining balance in the upright posture is higher in elderly fallers. Experimental Gerontology. 2016; 77:38-45. [DOI:10.1016/j.exger.2016.02.010] [PMID]
- Nagai K, Yamada M, Mori S, Tanaka B, Uemura K, Aoyama T, et al. Effect of the muscle coactivation during quiet standing on dynamic postural control in older adults. Archives of Gerontology and Geriatrics. 2013; 56(1):129-33. [DOI:10.1016/j.archger.2012.08.009] [PMID]
Type of Study: Research |
Subject:
Sport injury and corrective exercises
Received: 2024/06/26 | Accepted: 2024/10/20 | Published: 2025/07/13
Received: 2024/06/26 | Accepted: 2024/10/20 | Published: 2025/07/13
Send email to the article author
| Rights and permissions | |
 |
This work is licensed under a Creative Commons Attribution-NonCommercial 4.0 International License. |
This is an open access article distributed under the terms of the Creative Commons Attribution-NonCommercial 4.0 (CC-By-NC 4.0), which permits use, distribution, and reproduction in any medium, provided the original work is properly cited and is not used for commercial purposes.
Contact Information