Tue, Jul 28, 2026
Volume 14, Issue 3 (Summer 2024)
PTJ 2024, 14(3): 241-252 |
Back to browse issues page


Download citation:
BibTeX | RIS | EndNote | Medlars | ProCite | Reference Manager | RefWorks
Send citation to:


BibTeX | RIS | EndNote | Medlars | ProCite | Reference Manager | RefWorks
Send citation to:
Sheikhalizade H, Jafarnezhadgero A, Imanibrouj S, Mafi M, Asheghan M. Effect of Sand Training on Walking Mechanics in Men With Anterior Cruciate Ligament Reconstruction and Pronated Feet. PTJ 2024; 14 (3) :241-252
URL: http://ptj.uswr.ac.ir/article-1-601-en.html
URL: http://ptj.uswr.ac.ir/article-1-601-en.html
Hamed Sheikhalizade *1 

 , AmirAli Jafarnezhadgero1 , Sara Imanibrouj1 , Majid Mafi2 , Mahsa Asheghan3
, AmirAli Jafarnezhadgero1 , Sara Imanibrouj1 , Majid Mafi2 , Mahsa Asheghan3
1- Department of Sport Biomechanics, Faculty of Educational Sciences and Psychology, University of Mohaghegh Ardabili, Ardabil, Iran.
2- Biomedical Engineering Research Center, Baqiyatallah University of Medical Sciences, Tehran, Iran.
3- Department of Physical Medicine and Rehabilitation, School of Medicine, Baqiyatallah University of Medical Sciences, Tehran, Iran.
2- Biomedical Engineering Research Center, Baqiyatallah University of Medical Sciences, Tehran, Iran.
3- Department of Physical Medicine and Rehabilitation, School of Medicine, Baqiyatallah University of Medical Sciences, Tehran, Iran.
Full-Text [PDF 616 kb]
(775 Downloads)
| Abstract (HTML) (3725 Views)
Full-Text: (1520 Views)
Introduction
The occurrence of anterior cruciate ligament (ACL) injuries in male athletes ranged from 0.6% to 8.5% [1]. The prevalence rate of the pronated foot is about 14% in the population [2, 3]. During walking, the lateral pivot-shift phenomenon in the ACL-deficient knee is further compounded clinically by hyperpronation [4]. Following an initial injury, ACL reconstruction (ACLR) is a frequent procedure to restore stability of the knee joint and get patients back to their sports training programs. About 130000 ACLR operations and 250000 ACL injuries happen in the US each year [5].
ACLRs are associated with changes in walking and running mechanics that may affect cartilage injuries [6-9]. ACLR individuals experience greater vertical ground reaction force and loading rates (LR) [6], along with lower knee flexion moments [7, 9]. Walking following ACLR showed different knee kinematics and kinetics in the sagittal plane [10]. ACLR individuals demonstrated lower first and second vertical forces during walking [11] and these changes altered joint loading [11]. ACLR individiuals demonstrated had lower biceps femoris and vastus lateralis activities after fatigue protocol [6]. Moreover, increased activation of the vastus lateralis, biceps femoris, and gluteus maximus in ACLR individuals was observed during the landing phase after the fatigue protocol [7].
Over-pronated feet (OPF) lead to tibia malalignment [12], femur internal rotation [13], pelvis anterior tilt [14], and lumbar spine misalignment [15, 16] during walking [17]. Tibia and femur internal rotation caused by excessive pronation can lead to an anterior pelvis tilt [14, 18], abnormal lower limb kinematics [19, 20], changes in ground reaction forces (GRF) [21], altered muscle activities, such as erector spinae and gluteal muscles’ activity [22-24] and free moments [25, 26] during walking. Additionally, a strong correlation is observed between excessive foot pronation and meniscus tears, knee ligament sprains, ankle sprains, tibial stress fractures, and patella-femoral pain syndrome [27-29]. Also, the elevated GRF characteristics lead to greater load on the other above-mentioned joints [30-32].
Sand walking has received great attention from athletes and coaches as a successful adjunct to firm surface training protocols [33]. Walking on the sand produces more net knee extensor activity than walking on level, solid ground from a biomechanics standpoint [34]. A previous study showed that sand walking results in a lower positive peak of free moments (FM) and impact load compared with walking on stable ground [35]. Also, sand walking demonstrated a major impact on kinematic and kinetic variables in healthy and multiple sclerosis individuals [34, 36]. Therefore, it is possible that sand walking may alter biomechanical elements and impact how ACLR individuals walk [34]. Thus, this study was conducted to evaluate how sand training affects the gait patterns of those who had both ACL repair and pronated foot.
Materials and Methods
The present study was a quasi-experimental type. The G*Power software, version 3.1, was used to estimate the sample size [37]. In this software, the type I error was 0.05, the statistical power was 0.8, and the effect size value was 0.80. The software showed that at least 14 samples would be needed in each group. Twenty-eight males aged 22 to 25 with a history of pronated foot and ACLR volunteered to take part in the study. This study includes intervention group (IG, n=14) and control (n=14) groups. Both participants and examiners were blinded by group allocation [38, 39].
This study was conducted as a randomized, double-blind, controlled experiment (Figure 1).
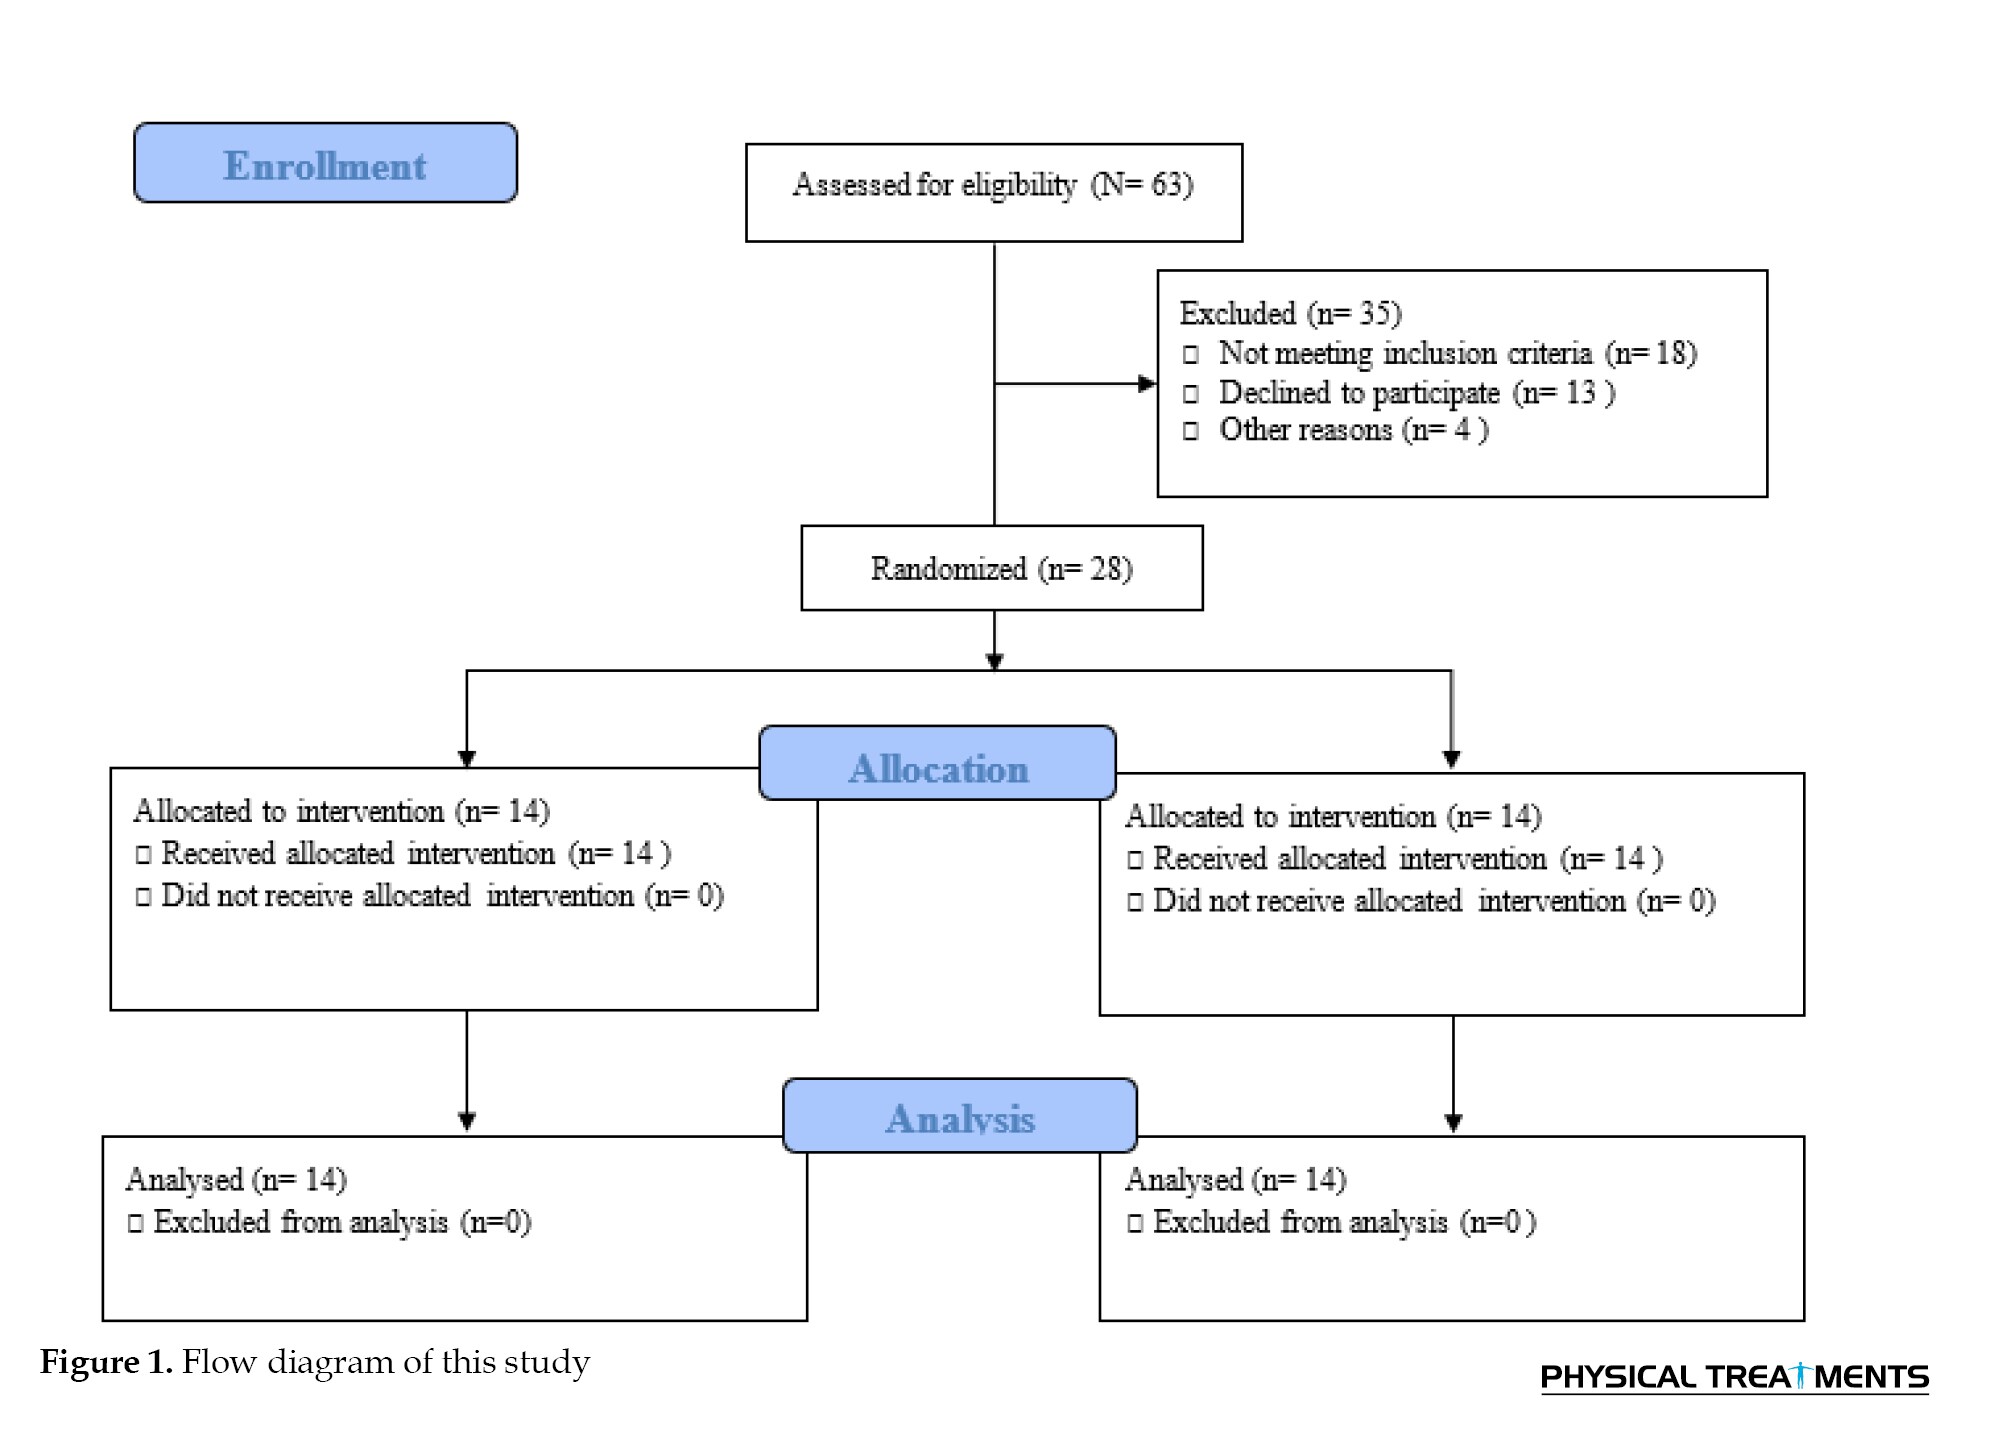
The following conditions are excluded, a history of regular exercise during the previous six months, and an inability to walk independently without pain. This study was conducted as a randomized, double-blind, controlled experiment.
Walking kinetics assessment
Walking GRF data was recorded at 1000 Hz using a force plate (Bertec Corporation, USA). The task required the participants to walk an 18-meter distance at a consistent pace of about 1.2 m/s. Five walking trials with a 5-minute rest between each one were performed at both pre-test and post-test.
GRFs data were analysed as mentioned by Jafarnezhadgero [35]. GRFs data was low pass filtered at 20 Hz. A 10 N vertical force threshold was used to determine the walking stance phase. The following dependent variables were extracted from walking data [35]. The vertical and anterior-posterior force curves yielded the initial impact vertical peak (FzHC), braking (FyHC), and propulsive forces (FyPO), respectively. The positive (lateral) peak (FxHC) and negative peak (FxPO) were computed using the medial-lateral curve. GRF amplitudes were expressed in percentage of body weight (BW). The interval between the first heel contact and the matching peak of GRF components was designated as the time to peak. The slope on the vertical force curve between heel contact and FzHC was used to define the loading rate. Additionally, the foot’s free moment (FM) was calculated. Five trials were used to average each walking variable [17].
Muscle activities assessment
The right limb’s tibialis anterior (TA), gastrocnemius medialis (Gas-M), biceps femoris (BF), semitendinosus (ST), vastus lateralis (VL), vastus medialis (VM), rectus femoris (RF), and gluteus medius (Glut-M) muscles were recorded using an EMG system (Biometrics Ltd., UK) with 8 pairs of Ag/AgCl electrodes [23]. The skin surface of the chosen muscles was cleaned with alcohol and shaved in compliance with the SENIAM technique [23]. The walking stance phase was split into three parts for EMG analyses, the loading phase (the first 0%–20%), mid-stance (20%–50%), and push-off (50%–100% of the stance) [37, 40-42]. To normalize EMG during walking, maximum voluntary isometric contraction (MVIC) was employed [43]. The identical protocols used during the pre-test were used to reevaluate the IG samples after 8 weeks of the intervention treatment. The post-tests were taken six days following the final training session [44].
Sand walking training protocol
The sand walking training protocol was performed for 8 weeks (three sessions each week). The protocol includes running, striding, leaping, and galloping in the barefoot condition on the sand surface [45]. A five-minute warm-up was conducted before each session [45]. Each training session lasted for fifty minutes [45], under the guidance of a seasoned physical therapist. After eight weeks, the control group (CG) underwent the same training as the IG but on a stable platform.
Statistical analyses
Using the Shapiro-Wilk test, the normal distribution of the data was confirmed. A mixed analysis of variance (ANOVA) test was employed to compare the results between the groups across time. Bonferroni tests were used for post-hoc analysis. Partial eta-squared (η2p) was converted to Cohen’s d to estimate the effect sizes (d<0.50 indicates modest effects, 0.50≤ d <0.80 indicates medium effects, and d ≥0.80 indicates big impacts). SPSS software, version 26, was used for all tests (significance threshold of 0.05).
Results
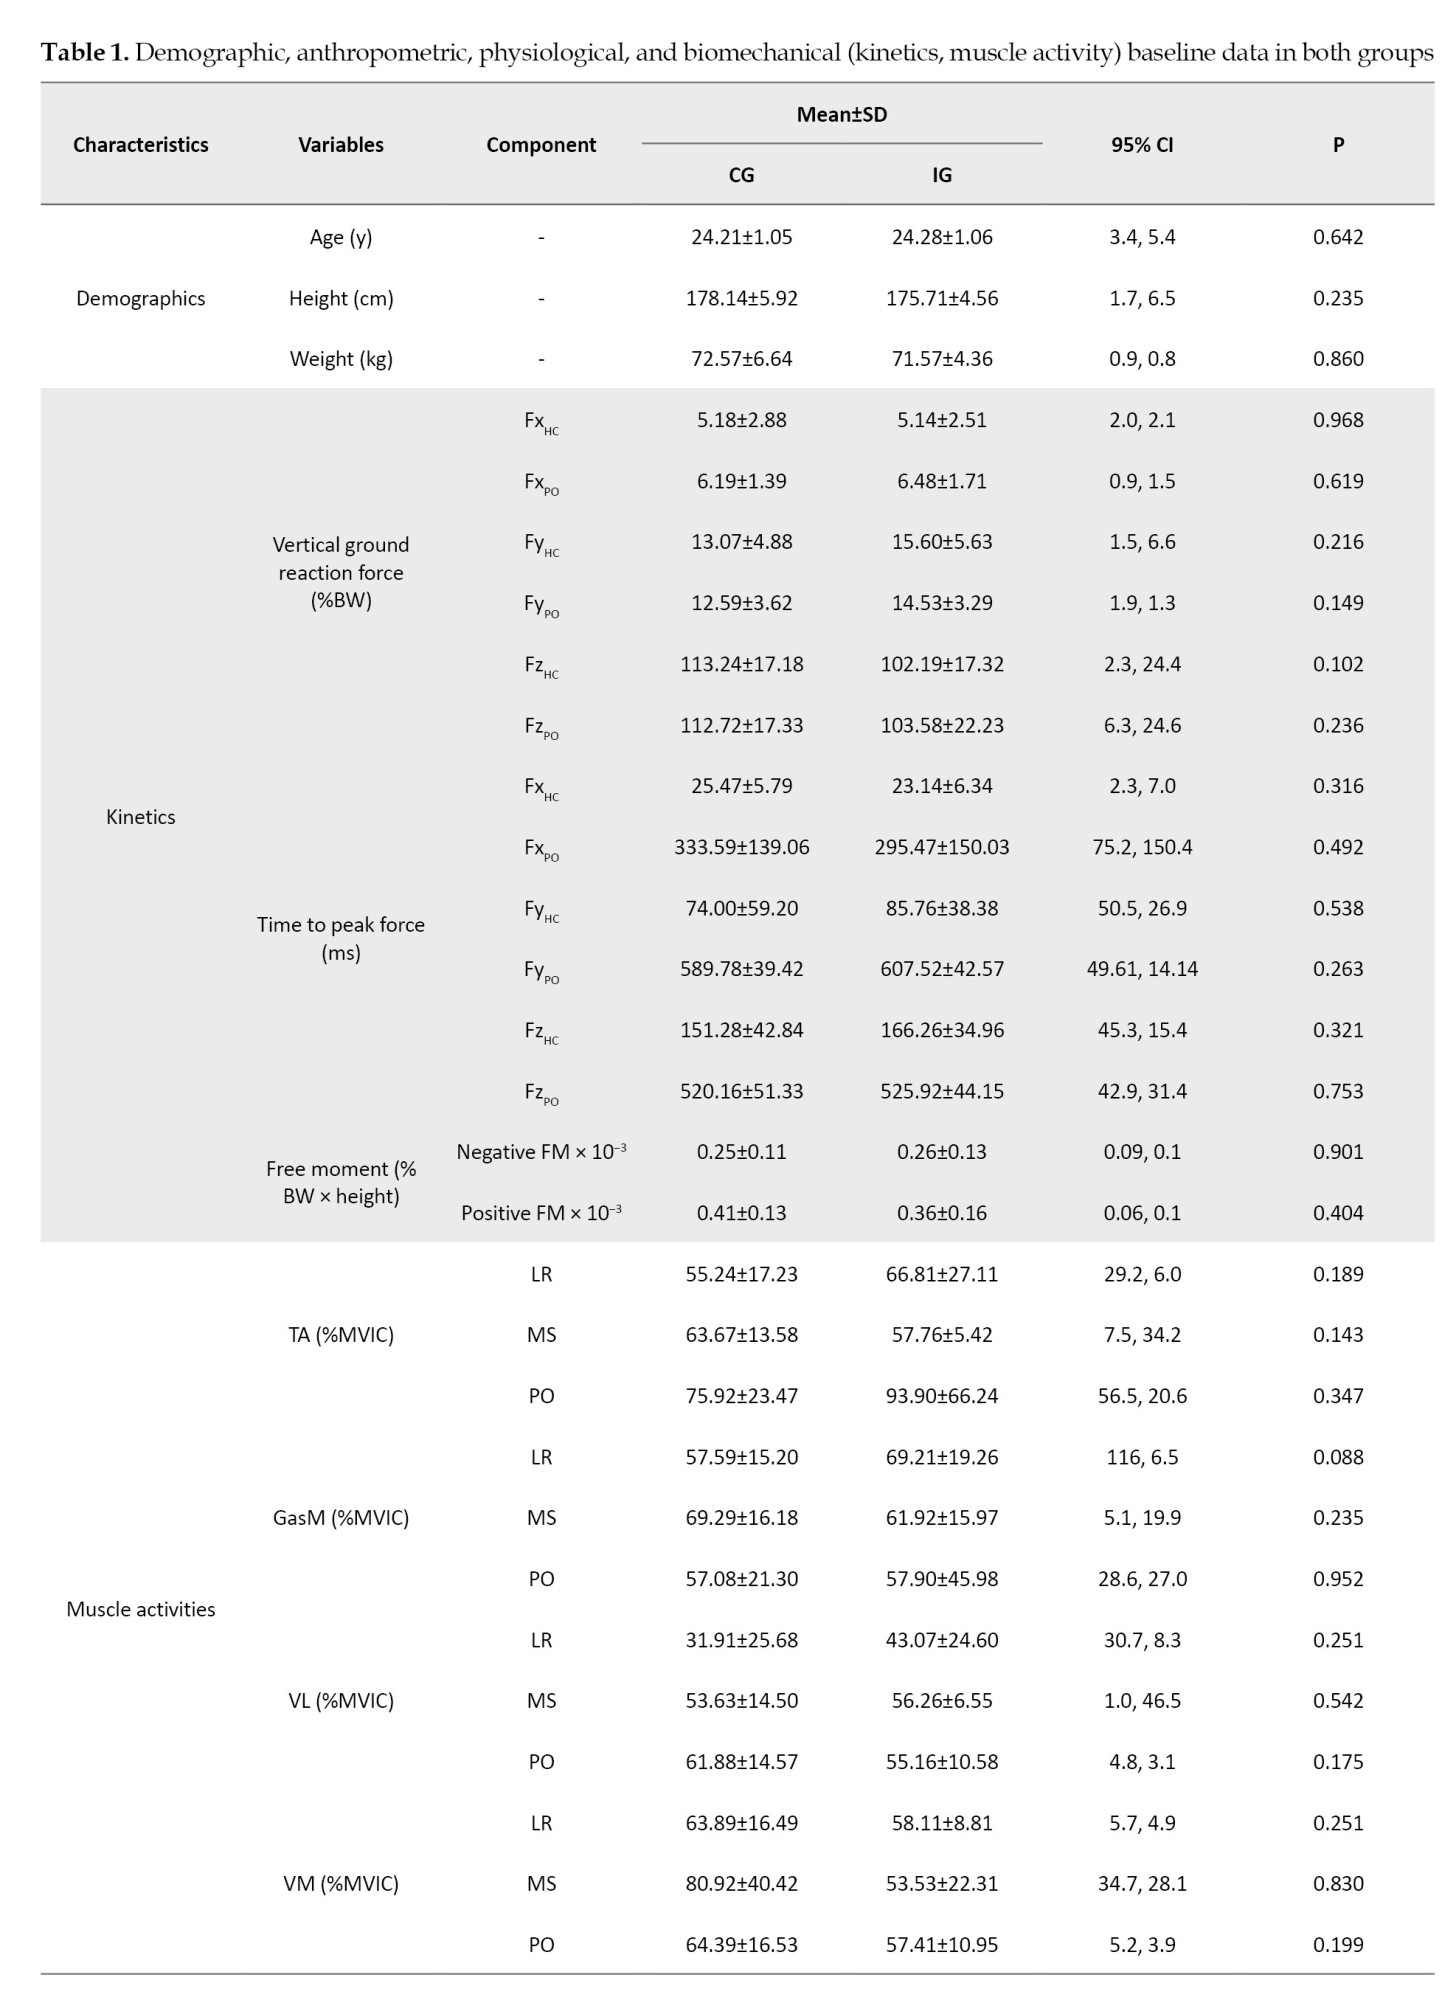
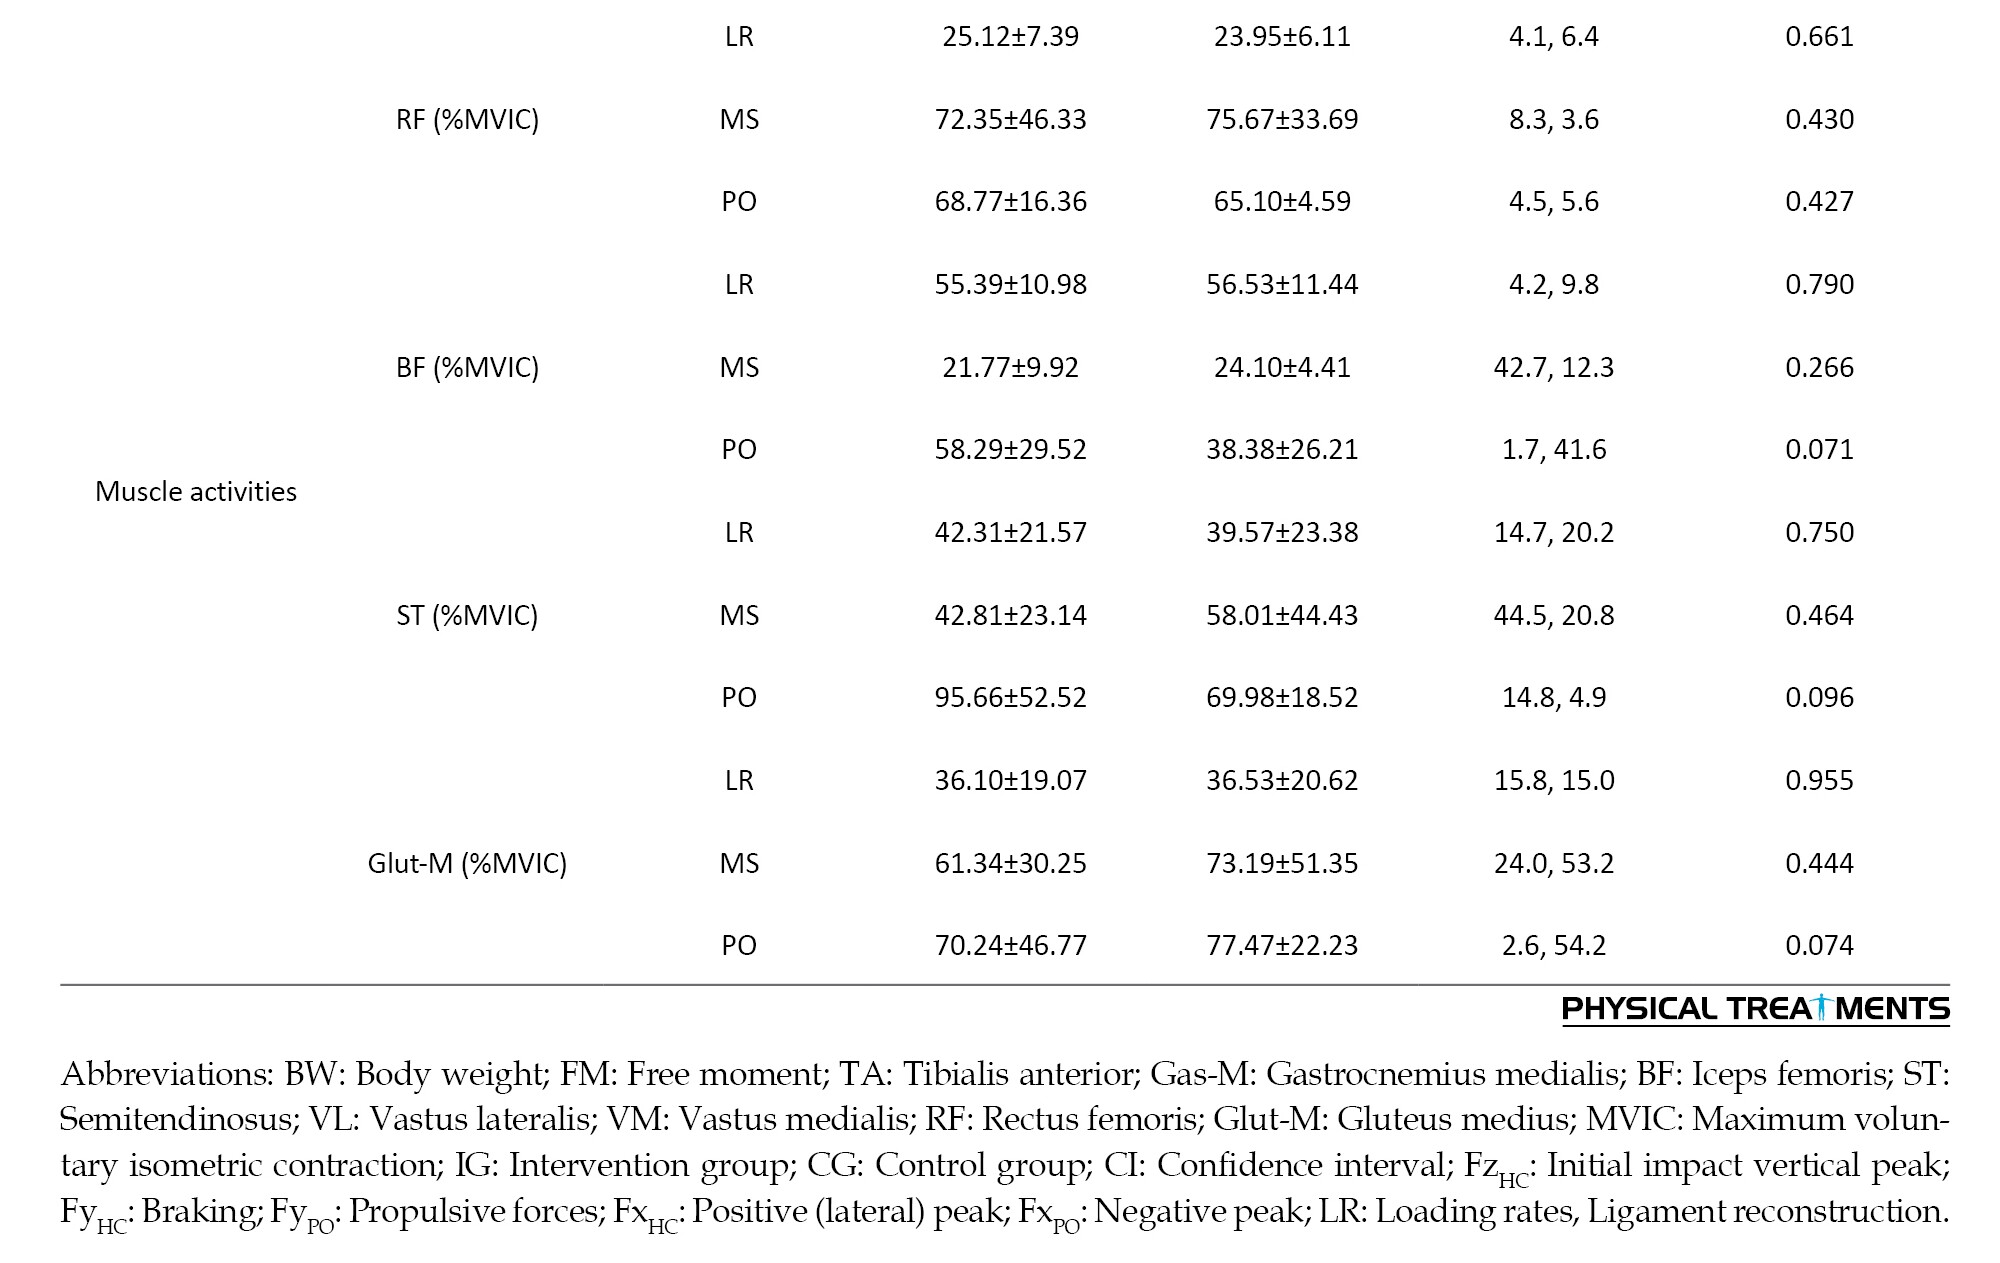
Table 1 presents the characteristics of the participants. Regarding the demographic and biomechanical data, no differences were observed between the groups at pre-test (P>0.05).
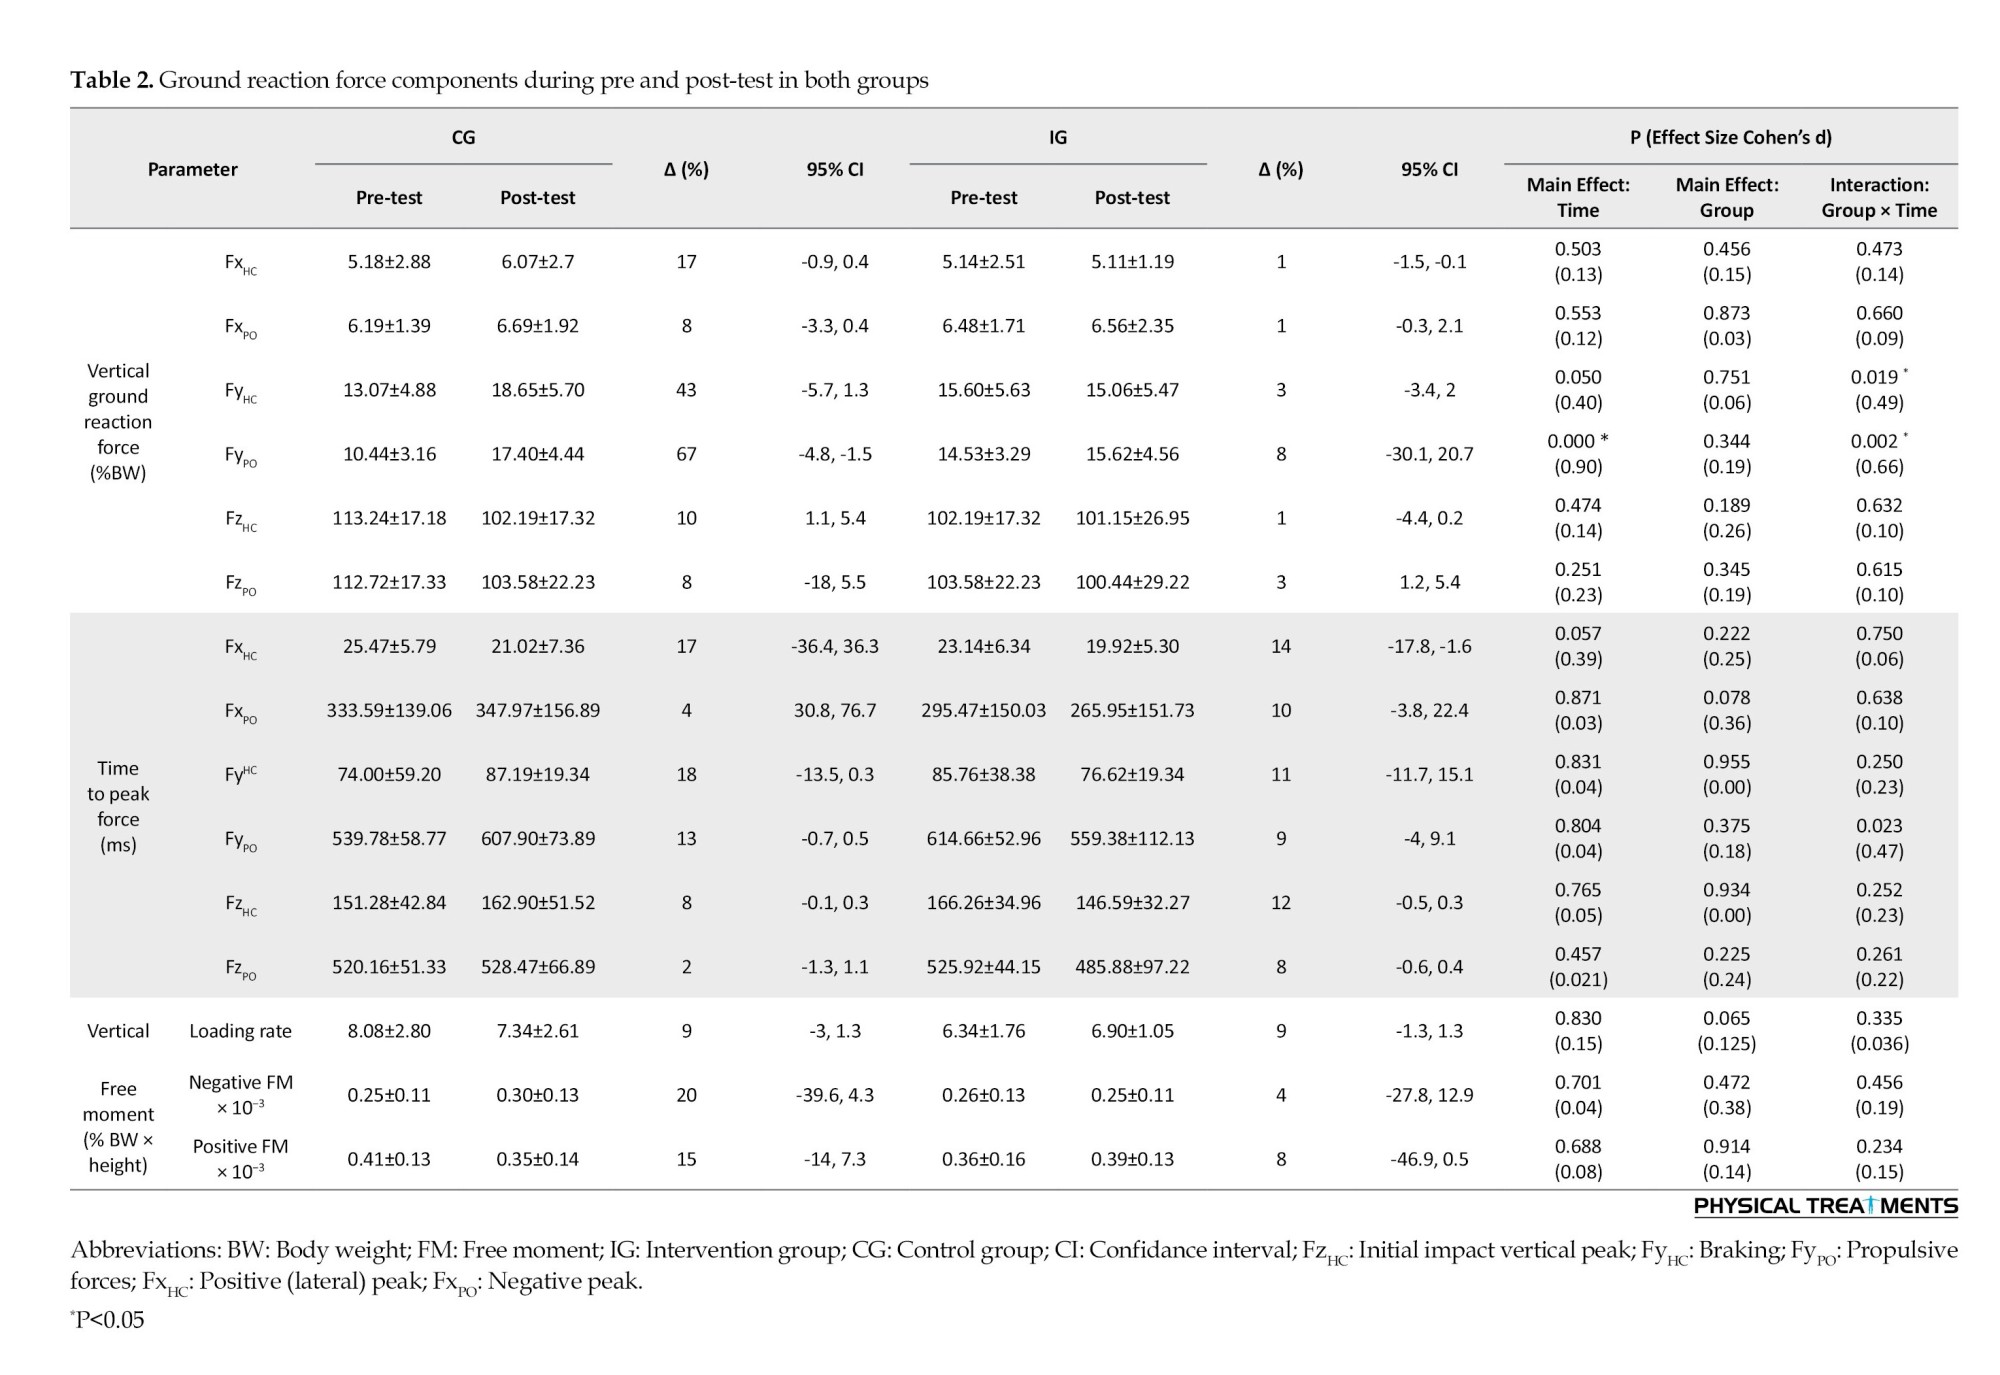
The results showed that time had a significant main influence on FyPO (P<0.001; d=0.90). A pairwise comparison showed that the post-test FyPO was significantly lower than the pre-test. Furthermore, FyPO and FyHC showed significant group-by-time interactions (P<0.019; d=0.49-0.66) (Table 2). FyHC and FyPO significantly increased in the CG but not in the IG, according to posthoc analysis.
For VM during loading, mid-stance, and push-off, RF during loading, BF during loading, mid-stance, and push-off phases, ST during mid-stance and push-off, and Glut-M during loading, mid-stance, and push-off phases, the results showed a substantial main effect of time (P<0.045; d=0.61-3.22). When comparing the pre-test and post-test data, it was evident that more VM activity was significantly observed during the loading,mid-stance, and push-off phases. Additionally, a paired-wise comparison showed that more RF activity was significantly observed throughout the loading and push-off phases in the pre-test than in the post-test. When comparing the pre-test and post-test pairwise, it was evident that the BF activity throughout the loading, mid-stance, and push-off phases had significantly increased. Additionally, a paired-wise comparison showed significantly greater ST activity throughout the push-off phase and mid-stance in the pre-test than in the post-test. Additionally, a paired-wise comparison showed that the pre-test and post-test Glut-M activity significantly increased throughout the loading, mid-stance, and push-off phases.
Group-by-time interactions were significant for VL, VM, and RF activities during the loading phase (P<0.043; d=0.50-1.23) (Table 3). Greater Gas-M activities were shown in the post-test in the IG during the loading and mid-stance stages, but not in the CG. Moreover, a paired-wise comparison showed higher VL activity during the loading stages in IG but not in the CG. Also, post-hoc analysis showed greater RF and BF activities during the push-off phase at IG but not in the CG. Significant group-by-time interactions were observed for VL, VM, and RF activities during the loading phase (P<0.043; d=0.70-0.88). In IG, but not CG, post-hoc analysis revealed higher VL activity at the post-test than at the pre-test. Additionally, post-hoc analysis revealed that VM activity at post-test was lower in CG than in IG. Additionally, post-hoc analysis revealed that RF had higher activities in IG at the post-test compared to the pre-test.
Discussion
This study was conducted to assess the long-term effects of sand training on certain lower limb muscle activities in OPF patients.
Our results demonstrated a significant increase for FyHC and FyPO in CG but not in the IG. To the authors’ knowledge, no research has examined how long-term sand training affects walking kinematics in people with both ACLR and OPF. Our results demonstrated that sand training maintained GRF components after 8 weeks of training, while FyHC and FyPO changed in CG after 8 weeks of training on a stable surface. However, further study is warranted to better establish this issue. Research suggests that walking barefoot activates plantar cutaneous mechanoreceptors, especially on uneven ground like sand [42]. Better pronation control and a potential decrease in GRFs can result from the increased afferent input [43]. However, this is conjectural and requires confirmation in additional research. Our results showed that, in people with ACLR and pronated feet, exercise on sand may reduce the peak impact of FyHC and FyPO during walking on stable ground. As a result, the exercise regimen in place may help to prevent injuries. Future research should examine whether exercising regularly on sand lowers the risk of injury.
The results showed decreased activities for VM during the loading phase at the post-test compared to the pre-test in CG but not in IG. To the authors’ knowledge, no research has examined how long-term sand training affects muscle activity in people with both ACLR and OPF. A previous study showed higher VM and VL amplitudes in subjects with patellofemoral pain syndrome from patella instability and concluded that greater EMG activity reflected knee extensor weakness [46]. Therefore, lower VM during the loading phase at the post-test than in the pre-test in CG may be due to an increase in VM muscle strength and a stable surface. Also, the results showed greater RF and BF activities during the push-off phase at IG but not in the CG. Compared to healthy persons, prior research found that ACLR individuals had higher co-contraction ratios of the hamstrings-quadriceps and lower peak anterior–posterior shear force during a drop jump [47]. The biceps femoris is a major synergist of the ACL which operates to increase joint stability at the loading phase to decrease tibial translation [49, 50]. In ACLR individuals, the two quadriceps muscles have greater activity and the biceps femoris have less activity than normal subjects [51].
Conclusion
For example, in fully grown guys with repaired ACLs and pronated feet when walking, sand training enhanced the activation of the vastus lateralis muscle.
It is essential to recognize some of the current study’s shortcomings. First off, since we did not evaluate healthy control subjects, we cannot conclude that the non-OPF walking should follow the same methods. Second, we did not evaluate kinematic data.
Ethical Considerations
Compliance with ethical guidelines
This study was approved by the Ethics Committee of Baqiyatallah University of Medical Sciences (Code: IR.BMSU.BAQ.REQ.1399.050) and the study’s protocol was registered by the Iranian Registry of Clinical Trials (IRCT) (Code: IRCT20200912048696N1). Before the study, each subject confirmed a written consent form.
Funding
This research did not receive any grant from funding agencies in the public, commercial, or non-profit sectors.
Authors' contributions
Conceptualization and methodology, data collection, data analysis, and original draft preparation: Hamed Sheikhalizade, Amir Ali Jafarnezhadgero and Sara Imanibrouj; Review and editing: All authors.
Conflict of interest
The authors declared no conflict of interest.
Acknowledgments
The authors thank all individuals who participated in the present study.
References
The occurrence of anterior cruciate ligament (ACL) injuries in male athletes ranged from 0.6% to 8.5% [1]. The prevalence rate of the pronated foot is about 14% in the population [2, 3]. During walking, the lateral pivot-shift phenomenon in the ACL-deficient knee is further compounded clinically by hyperpronation [4]. Following an initial injury, ACL reconstruction (ACLR) is a frequent procedure to restore stability of the knee joint and get patients back to their sports training programs. About 130000 ACLR operations and 250000 ACL injuries happen in the US each year [5].
ACLRs are associated with changes in walking and running mechanics that may affect cartilage injuries [6-9]. ACLR individuals experience greater vertical ground reaction force and loading rates (LR) [6], along with lower knee flexion moments [7, 9]. Walking following ACLR showed different knee kinematics and kinetics in the sagittal plane [10]. ACLR individuals demonstrated lower first and second vertical forces during walking [11] and these changes altered joint loading [11]. ACLR individiuals demonstrated had lower biceps femoris and vastus lateralis activities after fatigue protocol [6]. Moreover, increased activation of the vastus lateralis, biceps femoris, and gluteus maximus in ACLR individuals was observed during the landing phase after the fatigue protocol [7].
Over-pronated feet (OPF) lead to tibia malalignment [12], femur internal rotation [13], pelvis anterior tilt [14], and lumbar spine misalignment [15, 16] during walking [17]. Tibia and femur internal rotation caused by excessive pronation can lead to an anterior pelvis tilt [14, 18], abnormal lower limb kinematics [19, 20], changes in ground reaction forces (GRF) [21], altered muscle activities, such as erector spinae and gluteal muscles’ activity [22-24] and free moments [25, 26] during walking. Additionally, a strong correlation is observed between excessive foot pronation and meniscus tears, knee ligament sprains, ankle sprains, tibial stress fractures, and patella-femoral pain syndrome [27-29]. Also, the elevated GRF characteristics lead to greater load on the other above-mentioned joints [30-32].
Sand walking has received great attention from athletes and coaches as a successful adjunct to firm surface training protocols [33]. Walking on the sand produces more net knee extensor activity than walking on level, solid ground from a biomechanics standpoint [34]. A previous study showed that sand walking results in a lower positive peak of free moments (FM) and impact load compared with walking on stable ground [35]. Also, sand walking demonstrated a major impact on kinematic and kinetic variables in healthy and multiple sclerosis individuals [34, 36]. Therefore, it is possible that sand walking may alter biomechanical elements and impact how ACLR individuals walk [34]. Thus, this study was conducted to evaluate how sand training affects the gait patterns of those who had both ACL repair and pronated foot.
Materials and Methods
The present study was a quasi-experimental type. The G*Power software, version 3.1, was used to estimate the sample size [37]. In this software, the type I error was 0.05, the statistical power was 0.8, and the effect size value was 0.80. The software showed that at least 14 samples would be needed in each group. Twenty-eight males aged 22 to 25 with a history of pronated foot and ACLR volunteered to take part in the study. This study includes intervention group (IG, n=14) and control (n=14) groups. Both participants and examiners were blinded by group allocation [38, 39].
This study was conducted as a randomized, double-blind, controlled experiment (Figure 1).
The following conditions are excluded, a history of regular exercise during the previous six months, and an inability to walk independently without pain. This study was conducted as a randomized, double-blind, controlled experiment.
Walking kinetics assessment
Walking GRF data was recorded at 1000 Hz using a force plate (Bertec Corporation, USA). The task required the participants to walk an 18-meter distance at a consistent pace of about 1.2 m/s. Five walking trials with a 5-minute rest between each one were performed at both pre-test and post-test.
GRFs data were analysed as mentioned by Jafarnezhadgero [35]. GRFs data was low pass filtered at 20 Hz. A 10 N vertical force threshold was used to determine the walking stance phase. The following dependent variables were extracted from walking data [35]. The vertical and anterior-posterior force curves yielded the initial impact vertical peak (FzHC), braking (FyHC), and propulsive forces (FyPO), respectively. The positive (lateral) peak (FxHC) and negative peak (FxPO) were computed using the medial-lateral curve. GRF amplitudes were expressed in percentage of body weight (BW). The interval between the first heel contact and the matching peak of GRF components was designated as the time to peak. The slope on the vertical force curve between heel contact and FzHC was used to define the loading rate. Additionally, the foot’s free moment (FM) was calculated. Five trials were used to average each walking variable [17].
Muscle activities assessment
The right limb’s tibialis anterior (TA), gastrocnemius medialis (Gas-M), biceps femoris (BF), semitendinosus (ST), vastus lateralis (VL), vastus medialis (VM), rectus femoris (RF), and gluteus medius (Glut-M) muscles were recorded using an EMG system (Biometrics Ltd., UK) with 8 pairs of Ag/AgCl electrodes [23]. The skin surface of the chosen muscles was cleaned with alcohol and shaved in compliance with the SENIAM technique [23]. The walking stance phase was split into three parts for EMG analyses, the loading phase (the first 0%–20%), mid-stance (20%–50%), and push-off (50%–100% of the stance) [37, 40-42]. To normalize EMG during walking, maximum voluntary isometric contraction (MVIC) was employed [43]. The identical protocols used during the pre-test were used to reevaluate the IG samples after 8 weeks of the intervention treatment. The post-tests were taken six days following the final training session [44].
Sand walking training protocol
The sand walking training protocol was performed for 8 weeks (three sessions each week). The protocol includes running, striding, leaping, and galloping in the barefoot condition on the sand surface [45]. A five-minute warm-up was conducted before each session [45]. Each training session lasted for fifty minutes [45], under the guidance of a seasoned physical therapist. After eight weeks, the control group (CG) underwent the same training as the IG but on a stable platform.
Statistical analyses
Using the Shapiro-Wilk test, the normal distribution of the data was confirmed. A mixed analysis of variance (ANOVA) test was employed to compare the results between the groups across time. Bonferroni tests were used for post-hoc analysis. Partial eta-squared (η2p) was converted to Cohen’s d to estimate the effect sizes (d<0.50 indicates modest effects, 0.50≤ d <0.80 indicates medium effects, and d ≥0.80 indicates big impacts). SPSS software, version 26, was used for all tests (significance threshold of 0.05).
Results
Table 1 presents the characteristics of the participants. Regarding the demographic and biomechanical data, no differences were observed between the groups at pre-test (P>0.05).
The results showed that time had a significant main influence on FyPO (P<0.001; d=0.90). A pairwise comparison showed that the post-test FyPO was significantly lower than the pre-test. Furthermore, FyPO and FyHC showed significant group-by-time interactions (P<0.019; d=0.49-0.66) (Table 2). FyHC and FyPO significantly increased in the CG but not in the IG, according to posthoc analysis.
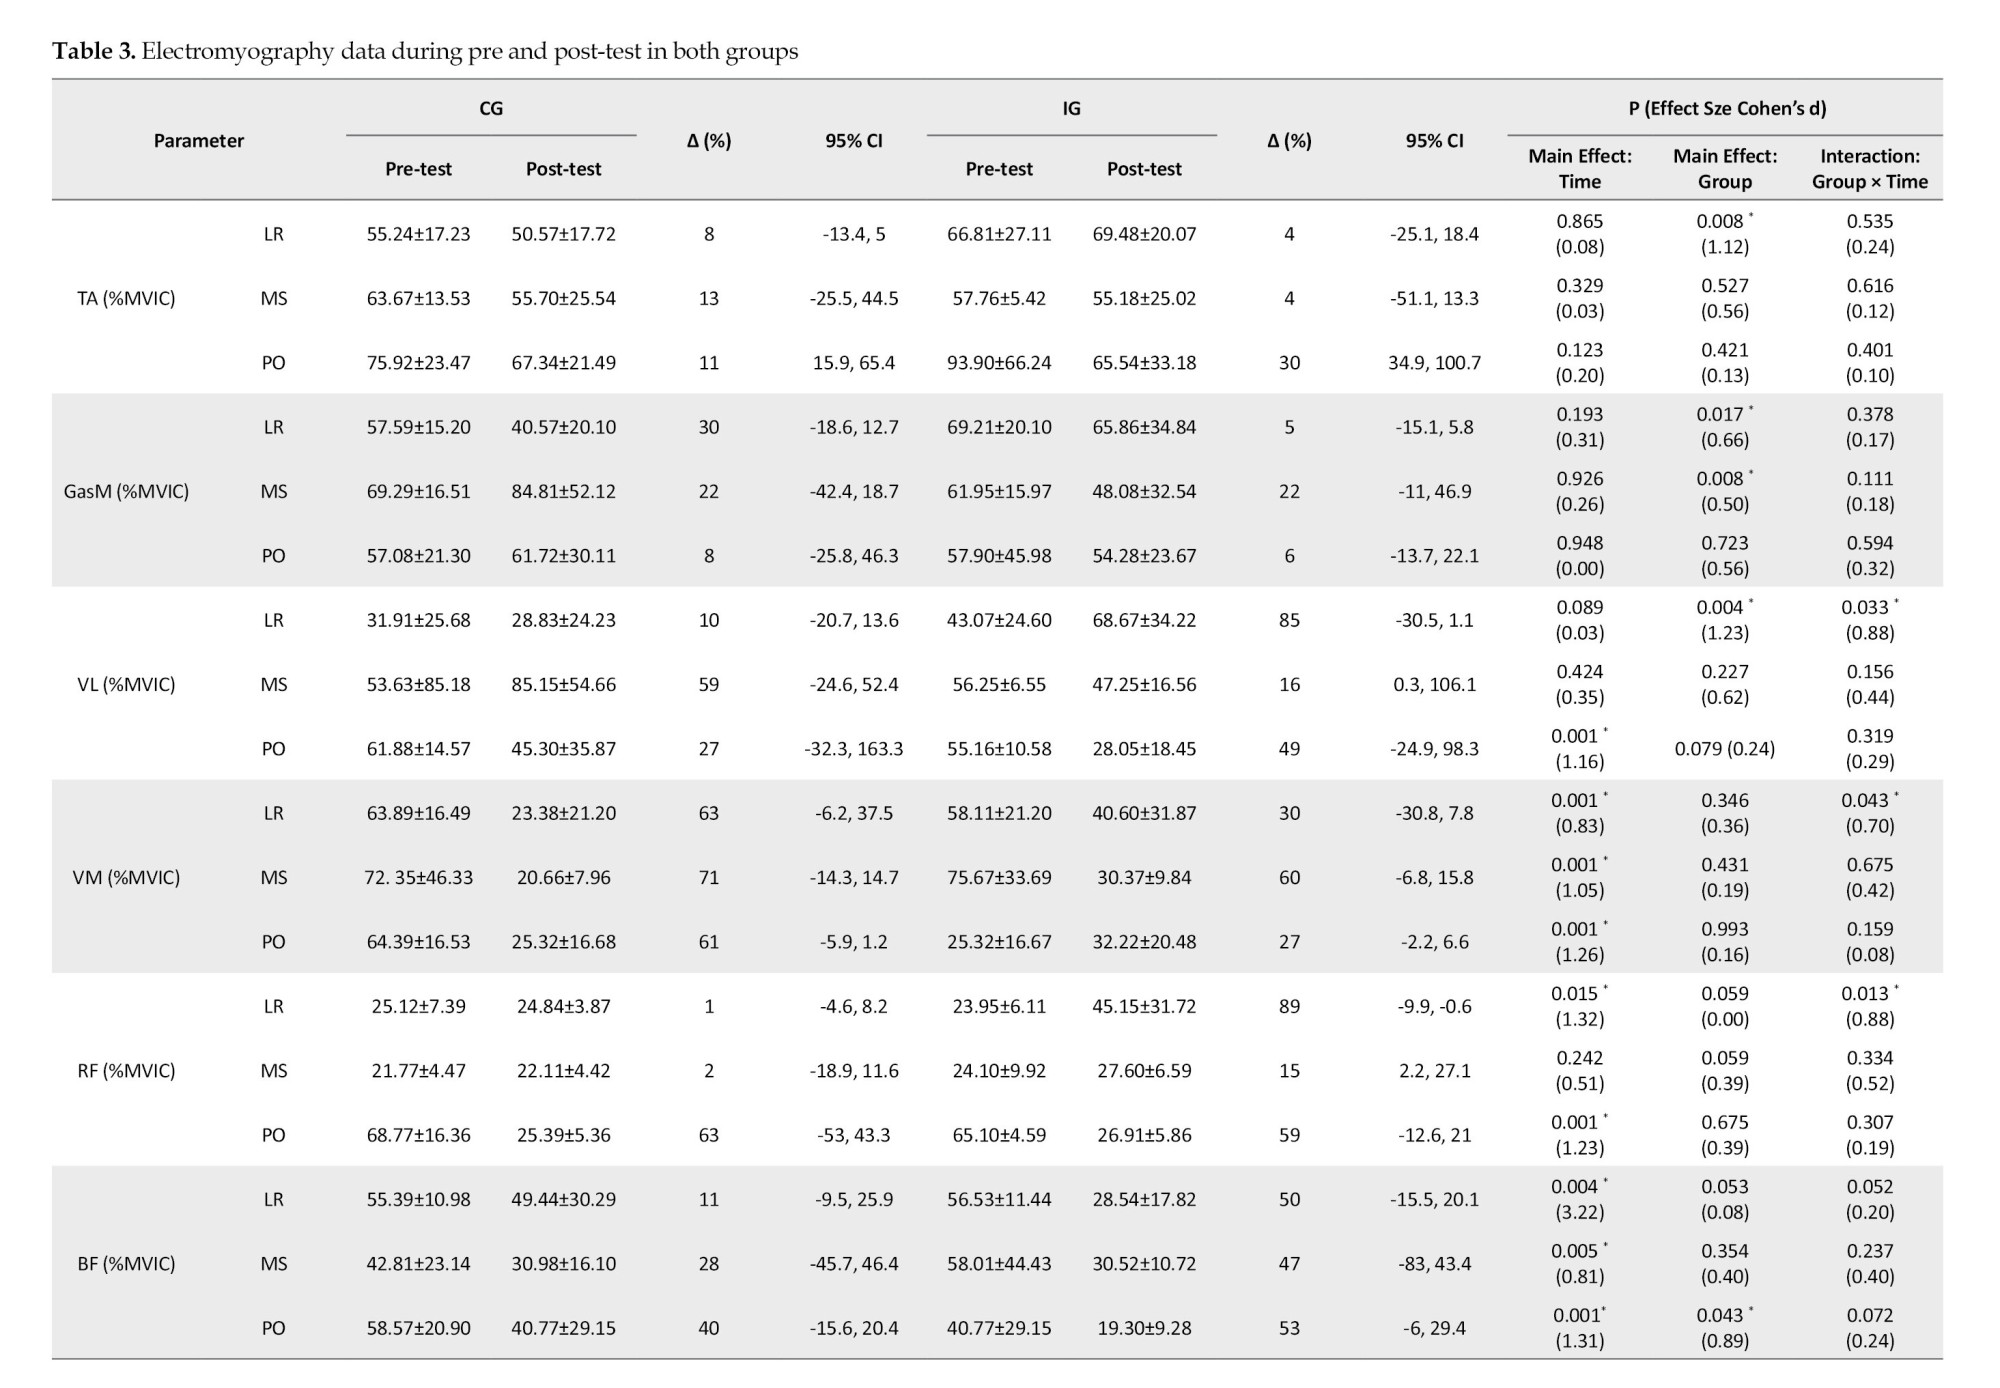
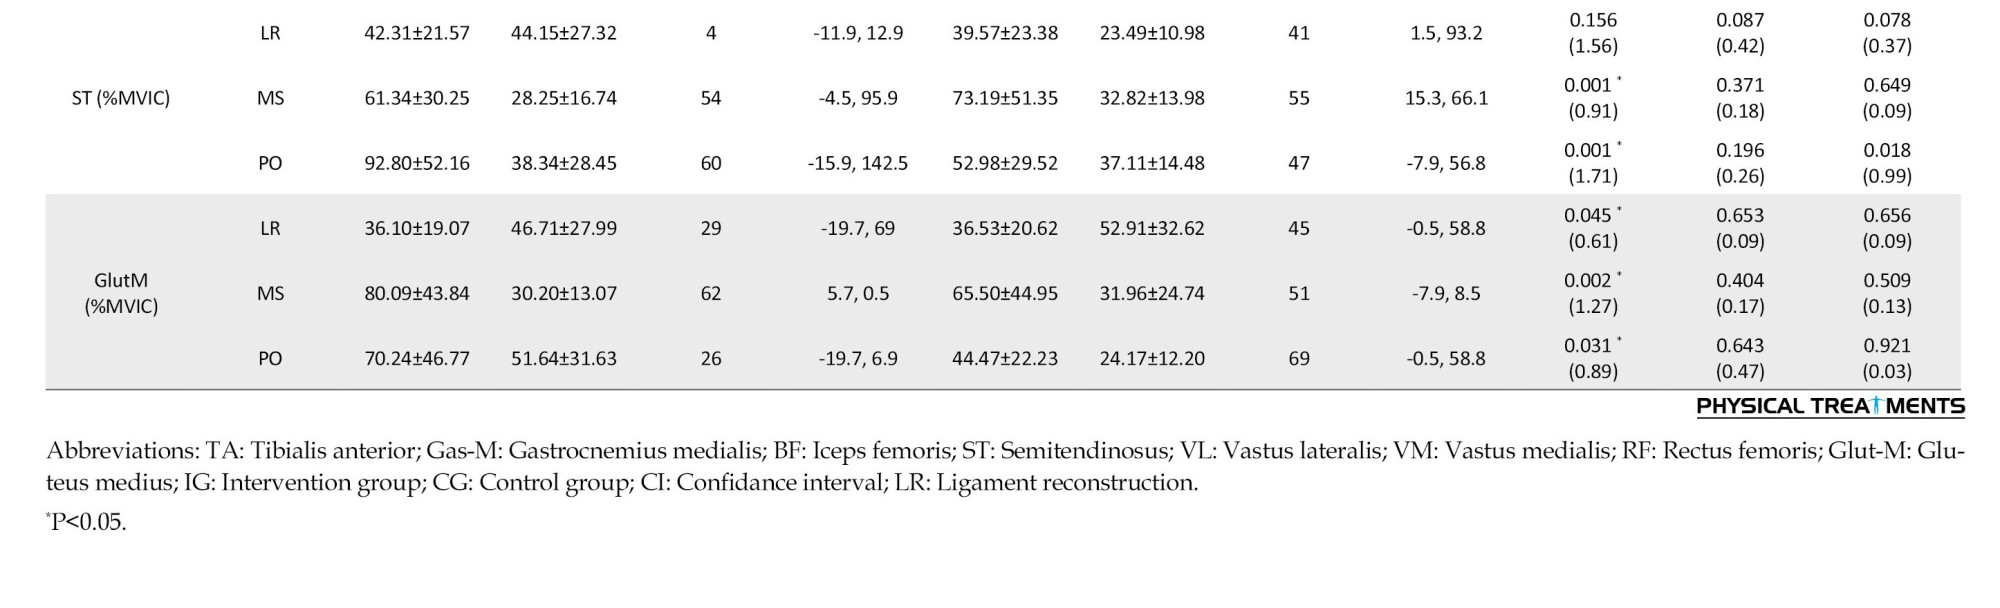
For VM during loading, mid-stance, and push-off, RF during loading, BF during loading, mid-stance, and push-off phases, ST during mid-stance and push-off, and Glut-M during loading, mid-stance, and push-off phases, the results showed a substantial main effect of time (P<0.045; d=0.61-3.22). When comparing the pre-test and post-test data, it was evident that more VM activity was significantly observed during the loading,mid-stance, and push-off phases. Additionally, a paired-wise comparison showed that more RF activity was significantly observed throughout the loading and push-off phases in the pre-test than in the post-test. When comparing the pre-test and post-test pairwise, it was evident that the BF activity throughout the loading, mid-stance, and push-off phases had significantly increased. Additionally, a paired-wise comparison showed significantly greater ST activity throughout the push-off phase and mid-stance in the pre-test than in the post-test. Additionally, a paired-wise comparison showed that the pre-test and post-test Glut-M activity significantly increased throughout the loading, mid-stance, and push-off phases.
Group-by-time interactions were significant for VL, VM, and RF activities during the loading phase (P<0.043; d=0.50-1.23) (Table 3). Greater Gas-M activities were shown in the post-test in the IG during the loading and mid-stance stages, but not in the CG. Moreover, a paired-wise comparison showed higher VL activity during the loading stages in IG but not in the CG. Also, post-hoc analysis showed greater RF and BF activities during the push-off phase at IG but not in the CG. Significant group-by-time interactions were observed for VL, VM, and RF activities during the loading phase (P<0.043; d=0.70-0.88). In IG, but not CG, post-hoc analysis revealed higher VL activity at the post-test than at the pre-test. Additionally, post-hoc analysis revealed that VM activity at post-test was lower in CG than in IG. Additionally, post-hoc analysis revealed that RF had higher activities in IG at the post-test compared to the pre-test.
Discussion
This study was conducted to assess the long-term effects of sand training on certain lower limb muscle activities in OPF patients.
Our results demonstrated a significant increase for FyHC and FyPO in CG but not in the IG. To the authors’ knowledge, no research has examined how long-term sand training affects walking kinematics in people with both ACLR and OPF. Our results demonstrated that sand training maintained GRF components after 8 weeks of training, while FyHC and FyPO changed in CG after 8 weeks of training on a stable surface. However, further study is warranted to better establish this issue. Research suggests that walking barefoot activates plantar cutaneous mechanoreceptors, especially on uneven ground like sand [42]. Better pronation control and a potential decrease in GRFs can result from the increased afferent input [43]. However, this is conjectural and requires confirmation in additional research. Our results showed that, in people with ACLR and pronated feet, exercise on sand may reduce the peak impact of FyHC and FyPO during walking on stable ground. As a result, the exercise regimen in place may help to prevent injuries. Future research should examine whether exercising regularly on sand lowers the risk of injury.
The results showed decreased activities for VM during the loading phase at the post-test compared to the pre-test in CG but not in IG. To the authors’ knowledge, no research has examined how long-term sand training affects muscle activity in people with both ACLR and OPF. A previous study showed higher VM and VL amplitudes in subjects with patellofemoral pain syndrome from patella instability and concluded that greater EMG activity reflected knee extensor weakness [46]. Therefore, lower VM during the loading phase at the post-test than in the pre-test in CG may be due to an increase in VM muscle strength and a stable surface. Also, the results showed greater RF and BF activities during the push-off phase at IG but not in the CG. Compared to healthy persons, prior research found that ACLR individuals had higher co-contraction ratios of the hamstrings-quadriceps and lower peak anterior–posterior shear force during a drop jump [47]. The biceps femoris is a major synergist of the ACL which operates to increase joint stability at the loading phase to decrease tibial translation [49, 50]. In ACLR individuals, the two quadriceps muscles have greater activity and the biceps femoris have less activity than normal subjects [51].
Conclusion
For example, in fully grown guys with repaired ACLs and pronated feet when walking, sand training enhanced the activation of the vastus lateralis muscle.
It is essential to recognize some of the current study’s shortcomings. First off, since we did not evaluate healthy control subjects, we cannot conclude that the non-OPF walking should follow the same methods. Second, we did not evaluate kinematic data.
Ethical Considerations
Compliance with ethical guidelines
This study was approved by the Ethics Committee of Baqiyatallah University of Medical Sciences (Code: IR.BMSU.BAQ.REQ.1399.050) and the study’s protocol was registered by the Iranian Registry of Clinical Trials (IRCT) (Code: IRCT20200912048696N1). Before the study, each subject confirmed a written consent form.
Funding
This research did not receive any grant from funding agencies in the public, commercial, or non-profit sectors.
Authors' contributions
Conceptualization and methodology, data collection, data analysis, and original draft preparation: Hamed Sheikhalizade, Amir Ali Jafarnezhadgero and Sara Imanibrouj; Review and editing: All authors.
Conflict of interest
The authors declared no conflict of interest.
Acknowledgments
The authors thank all individuals who participated in the present study.
References
- Waldén M, Hägglund M, Werner J, Ekstrand J. The epidemiology of anterior cruciate ligament injury in football (soccer): A review of the literature from a gender-related perspective. Knee Surgery, Sports Traumatology, Arthroscopy. 2011; 19(1):3-10. [DOI:10.1007/s00167-010-1172-7] [PMID]
- Bhoir T, Anap D, Diwate A. Prevalence of flat foot among 18-25 years old physiotherapy students: Cross sectional study. 2014; 3(4):272-8. [Link]
- Franco AH. Pes cavus and pes planus. Analyses and treatment. Physical Therapy. 1987; 67(5):688-94. [DOI:10.1093/ptj/67.5.688] [PMID]
- Tiberio D. The effect of excessive subtalar joint pronation on patellofemoral mechanics: A theoretical model. The Journal of Orthopaedic and Sports Physical Therapy. 1987; 9(4):160-5. [DOI:10.2519/jospt.1987.9.4.160] [PMID]
- Mall NA, Chalmers PN, Moric M, Tanaka MJ, Cole BJ, Bach BR Jr, et al. Incidence and trends of anterior cruciate ligament reconstruction in the United States. The American Journal of Sports Medicine. 2014; 42(10):2363-70. [DOI:10.1177/0363546514542796] [PMID]
- Noehren B, Wilson H, Miller C, Lattermann C. Long-term gait deviations in anterior cruciate ligament-reconstructed females. Medicine and Science in Sports and Exercise. 2013; 45(7):1340-7. [DOI:10.1249/MSS.0b013e318285c6b6] [PMID] [PMCID]
- Lewek M, Rudolph K, Axe M, Snyder-Mackler L. The effect of insufficient quadriceps strength on gait after anterior cruciate ligament reconstruction. Clinical Biomechanics. 2002; 17(1):56-63. [DOI:10.1016/S0268-0033(01)00097-3] [PMID]
- Blackburn JT, Pietrosimone B, Harkey MS, Luc BA, Pamukoff DN. Inter-limb differences in impulsive loading following anterior cruciate ligament reconstruction in females. Journal of Biomechanics. 2016; 49(13):3017-21. [DOI:10.1016/j.jbiomech.2016.07.030] [PMID]
- Kuenze C, Hertel J, Weltman A, Diduch DR, Saliba S, Hart JM. Jogging biomechanics after exercise in individuals with ACL-reconstructed knees. Medicine and Science in Sports and Exercise. 2014; 46(6):1067-76. [DOI:10.1249/MSS.0000000000000217] [PMID]
- Pairot-de-Fontenay B, Willy RW, Elias ARC, Mizner RL, Dubé MO, Roy JS. Running biomechanics in individuals with anterior cruciate ligament reconstruction: A Systematic Review. Sports Medicine. 2019; 49(9):1411-24. [DOI:10.1007/s40279-019-01120-x] [PMID]
- Milandri G, Posthumus M, Small TJ, Bothma A, van der Merwe W, Kassanjee R, et al. Kinematic and kinetic gait deviations in males long after anterior cruciate ligament reconstruction. Clinical Biomechanics. 2017; 49:78-84. [DOI:10.1016/j.clinbiomech.2017.07.012] [PMID]
- Levinger P, Menz HB, Morrow AD, Feller JA, Bartlett JR, Bergman NR. Foot kinematics in people with medial compartment knee osteoarthritis. Rheumatology. 2012; 51(12):2191-8. [DOI:10.1093/rheumatology/kes222] [PMID]
- Souza TR, Pinto RZ, Trede RG, Kirkwood RN, Fonseca ST. Temporal couplings between rearfoot-shank complex and hip joint during walking. Clinical Biomechanics. 2010; 25(7):745-8. [DOI:10.1016/j.clinbiomech.2010.04.012] [PMID]
- Khamis S, Yizhar Z. Effect of feet hyperpronation on pelvic alignment in a standing position. Gait & Posture. 2007; 25(1):127-34. [DOI:10.1016/j.gaitpost.2006.02.005] [PMID]
- Bird AR, Payne Cb. Foot function and low back pain. The Foot. 1999; 9(4):175-80. [DOI:10.1054/foot.1999.0563]
- Pinto RZ, Souza TR, Trede RG, Kirkwood RN, Figueiredo EM, Fonseca ST. Bilateral and unilateral increases in calcaneal eversion affect pelvic alignment in standing position. Manual Therapy 2008; 13(6):513-9. DOI:10.1016/j.math.2007.06.004] [PMID]
- Duval K, Lam T, Sanderson D. The mechanical relationship between the rearfoot, pelvis and low-back. Gait & Posture. 2010; 32(4):637-40. [DOI:10.1016/j.gaitpost.2010.09.007] [PMID]
- Betsch M, Wild M, Große B, Rapp W, Horstmann T. The effect of simulating leg length inequality on spinal posture and pelvic position: A dynamic rasterstereographic analysis. European Spine Journal. 2012; 21(4):691-7. [DOI:10.1007/s00586-011-1912-5] [PMID] [PMCID]
- Kendall JC, Bird AR, Azari MF. Foot posture, leg length discrepancy and low back pain--their relationship and clinical management using foot orthoses--An overview. Foot. 2014; 24(2):75-80. [DOI:10.1016/j.foot.2014.03.004] [PMID]
- Müller R, Ertelt T, Blickhan R. Low back pain affects trunk as well as lower limb movements during walking and running. Journal of Biomechanics. 2015; 48(6):1009-14. [DOI:10.1016/j.jbiomech.2015.01.042] [PMID]
- Shum GL, Crosbie J, Lee RY. Three-dimensional kinetics of the lumbar spine and hips in low back pain patients during sit-to-stand and stand-to-sit. Spine. 2007; 32(7):E211-9. [DOI:10.1097/01.brs.0000259204.05598.10] [PMID]
- Murley GS, Landorf KB, Menz HB, Bird AR. Effect of foot posture, foot orthoses and footwear on lower limb muscle activity during walking and running: A systematic review. Gait & Posture. 2009; 29(2):172-87. [DOI:10.1016/j.gaitpost.2008.08.015] [PMID]
- Hanada EY, Johnson M, Hubley-Kozey C. A comparison of trunk muscle activation amplitudes during gait in older adults with and without chronic low back pain. PM & R. 2011; 3(10):920-8. [DOI:10.1016/j.pmrj.2011.06.002] [PMID]
- van der Hulst M, Vollenbroek-Hutten MM, Rietman JS, Hermens HJ. Lumbar and abdominal muscle activity during walking in subjects with chronic low back pain: support of the "guarding" hypothesis? Journal of Electromyography and Kinesiology. 2010; 20(1):31-8. [DOI:10.1016/j.jelekin.2009.03.009] [PMID]
- Bolgla LA, Malone TR, Umberger BR, Uhl TL. Hip strength and hip and knee kinematics during stair descent in females with and without patellofemoral pain syndrome. The Journal of Orthopaedic and Sports Physical Therapy. 2008; 38(1):12-8. [DOI:10.2519/jospt.2008.2462] [PMID]
- Li Y, Wang W, Crompton RH, Gunther MM. Free vertical moments and transverse forces in human walking and their role in relation to arm-swing. The Journal of Experimental Biology. 2001; 204(Pt 1):47-58. [DOI:10.1242/jeb.204.1.47] [PMID]
- Lun V, Meeuwisse WH, Stergiou P, Stefanyshyn D. Relation between running injury and static lower limb alignment in recreational runners. British Journal of Sports Medicine. 2004; 38(5):576-80. [DOI:10.1136/bjsm.2003.005488] [PMID] [PMCID]
- Kothari A, Dixon PC, Stebbins J, Zavatsky AB, Theologis T. Are flexible flat feet associated with proximal joint problems in children? Gait & Posture. 2016; 45:204-10. [DOI:10.1016/j.gaitpost.2016.02.008] [PMID]
- Escamilla-Martínez E, Martínez-Nova A, Gómez-Martín B, Sánchez-Rodríguez R, Fernández-Seguín LM. The effect of moderate running on foot posture index and plantar pressure distribution in male recreational runners. Journal of the American Podiatric Medical Association. 2013; 103(2):121-5. [DOI:10.7547/1030121] [PMID]
- Kase K, Wallis J, Kase T. Clinical therapeutic applications of the kinesio taping method. Albuquerque: Kinesio Taping Association International; 2003. [Link]
- Tsai CT, Chang WD, Lee JP. Effects of short-term treatment with kinesiotaping for plantar fasciitis. Journal of Musculoskeletal pain. 2010; 18(1):71-80. [DOI:10.3109/10582450903495882]
- Luque-Suarez A, Gijon-Nogueron G, Baron-Lopez FJ, Labajos-Manzanares MT, Hush J, Hancock MJ. Effects of kinesiotaping on foot posture in participants with pronated foot: a quasi-randomised, double-blind study. Physiotherapy. 2014; 100(1):36-40. [DOI:10.1016/j.physio.2013.04.005] [PMID]
- Wischnia BJRW, July. Beach running. 1982; 76:48-9.
- Pinnington HC, Lloyd DG, Besier TF, Dawson B. Kinematic and electromyography analysis of submaximal differences running on a firm surface compared with soft, dry sand. European Journal of Applied Physiology. 2005; 94(3):242-53. [DOI:10.1007/s00421-005-1323-6] [PMID]
- Jafarnezhadgero A, Fatollahi A, Amirzadeh N, Siahkouhian M, Granacher U. Ground reaction forces and muscle activity while walking on sand versus stable ground in individuals with pronated feet compared with healthy controls. Plos One. 2019; 14(9):e0223219. [DOI:10.1371/journal.pone.0223219] [PMID] [PMCID]
- van den Berg MEL, Barr CJ, McLoughlin JV, Crotty M. Effect of walking on sand on gait kinematics in individuals with multiple sclerosis. Multiple Sclerosis and Related Disorders. 2017; 16:15-21. [DOI:10.1016/j.msard.2017.05.008] [PMID]
- Jafarnezhadgero A, Fatollahi A, Sheykholeslami A, Dionisio VC, Akrami M. Long-term training on sand changes lower limb muscle activities during running in runners with over-pronated feet. Biomedical Engineering Online. 2021; 20(1):118. [DOI:10.1186/s12938-021-00955-8] [PMID] [PMCID]
- Wei LJ, Lachin JM. Properties of the urn randomization in clinical trials. Controlled Clinical Trials. 1988; 9(4):345-64. [DOI:10.1016/0197-2456(88)90048-7] [PMID]
- Frane JW. A method of biased coin randomization, its implementation, and its validation. 1998; 32(2):423-32. [DOI:10.1177/009286159803200213]
- Jafarnezhadgero A, Ghorbanloo F, Fatollahi A, Dionisio VC, Granacher U. Effects of an elastic resistance band exercise program on kinetics and muscle activities during walking in young adults with genu valgus: A double-blinded randomized controlled trial. Clinical Biomechanics. 2021; 81:105215. [DOI:10.1016/j.clinbiomech.2020.105215] [PMID]
- Whittle MW. Gait analysis: An introduction. Amsterdam: Elsevier Science; 2014. [Link]
- Dugan SA, Bhat KP. Biomechanics and analysis of running gait. Physical Medicine and Rehabilitation Clinics of North America. 2005; 16(3):603-21. [DOI:10.1016/j.pmr.2005.02.007] [PMID]
- Besomi M, Hodges PW, Clancy EA, Van Dieën J, Hug F, Lowery M, et al. Consensus for experimental design in electromyography (CEDE) project: Amplitude normalization matrix. Journal of Electromyography and Kinesiology. 2020; 53:102438. [DOI:10.1016/j.jelekin.2020.102438] [PMID]
- Jafarnezhadgero A, Madadi-Shad M, McCrum C, Karamanidis K. Effects of corrective training on drop landing ground reaction force characteristics and lower limb kinematics in older adults with genu valgus: A randomized controlled trial. Journal of Aging and Physical Activity. 2019; 27(1):9-17. [DOI:10.1123/japa.2017-0315] [PMID]
- Durai DBJ, Shaju M. Effect of sand running training on speed among school boys. International Journal of Physical Education, Sports and Health. 2019; 6(3):117-22. [Link]
- Mohr KJ, Kvitne RS, Pink MM, Fideler B, Perry J. Electromyography of the quadriceps in patellofemoral pain with patellar subluxation. Clinical Orthopaedics and Related Research. 2003; (415):261-71. [DOI:10.1097/01.blo.0000093918.26658.6a] [PMID]
- Gokeler A, Hof AL, Arnold MP, Dijkstra PU, Postema K, Otten E. Abnormal landing strategies after ACL reconstruction. Scandinavian Journal of Medicine & Science in Sports. 2010; 20(1):e12-9. [DOI:10.1111/j.1600-0838.2008.00873.x] [PMID]
- Imran A, O'Connor JJ. Control of knee stability after ACL injury or repair: Interaction between hamstrings contraction and tibial translation. Clinical Biomechanics. 1998; 13(3):153-62. [DOI:10.1016/S0268-0033(97)00030-2] [PMID]
- Lafortune MA, Cavanagh PR, Sommer HJ 3rd, Kalenak A. Three-dimensional kinematics of the human knee during walking. Journal of Biomechanics. 1992; 25(4):347-57. [DOI:10.1016/0021-9290(92)90254-X] [PMID]
- Pandy MG, Shelburne KB. Theoretical analysis of ligament and extensor-mechanism function in the ACL-deficient knee. Clinical Biomechanics. 1998; 13(2):98-111. [DOI:10.1016/S0268-0033(97)00055-7] [PMID]
- Limbird TJ, Shiavi R, Frazer M, Borra H. EMG profiles of knee joint musculature during walking: Changes induced by anterior cruciate ligament deficiency. Journal of Orthopaedic Research. 1988; 6(5):630-8. [DOI:10.1002/jor.1100060503] [PMID]
Type of Study: Research |
Subject:
General
Received: 2023/09/25 | Accepted: 2024/07/25 | Published: 2024/07/1
Received: 2023/09/25 | Accepted: 2024/07/25 | Published: 2024/07/1
Send email to the article author
| Rights and permissions | |
 |
This work is licensed under a Creative Commons Attribution-NonCommercial 4.0 International License. |
This is an open access article distributed under the terms of the Creative Commons Attribution-NonCommercial 4.0 (CC-By-NC 4.0), which permits use, distribution, and reproduction in any medium, provided the original work is properly cited and is not used for commercial purposes.
Contact Information