Sat, Apr 20, 2024
Volume 11, Issue 2 (Spring 2021)
PTJ 2021, 11(2): 131-138 |
Back to browse issues page


Download citation:
BibTeX | RIS | EndNote | Medlars | ProCite | Reference Manager | RefWorks
Send citation to:


BibTeX | RIS | EndNote | Medlars | ProCite | Reference Manager | RefWorks
Send citation to:
Estiri Z, Hejazi K. Prediction of Overweight/Obesity by Anthropometric Indices in Male Students. PTJ 2021; 11 (2) :131-138
URL: http://ptj.uswr.ac.ir/article-1-483-en.html
URL: http://ptj.uswr.ac.ir/article-1-483-en.html


1- Department of Physical Education and Sport Sciences, Faculty of Sport Sciences, Hakim Sabzevari University, Sabzevar, Iran.
Full-Text [PDF 582 kb]
(814 Downloads)
| Abstract (HTML) (1584 Views)
Full-Text: (515 Views)
1. Introduction
Overweight and obesity cause life-threatening non-transmittable conditions, including cardiovascular disorders (heart attack and stroke), type 2 diabetes, some tumors, and so on [1]. Many authors identified microscopic index analysis as a realistic and easy way of measuring obesity and risk factors for heart disease [2, 3]. For this reason, they measure the body’s composition using the most significant clinical parameters, including the Body Mass Index (BMI), Waist Circumference (WC), hip circumference, Waist-to-Hip Ratio (WHR), and Waist-to-Height Ratio (WHtR) [4, 5].
Researchers have found that the Low-Density Lipoprotein Cholesterol (LDL-C) fat levels and the systolic and diastolic blood pressure of both genders are the strongest determinants [6, 7]. A significant independent medical parameter to identify vascular impairment is often abdominal obesity or the rise of the WHR. A cut-off point of cardiovascular risk factors is WHR ≥0.9 for males and ≥0.8 for females [8]. BMI is a popular and essential approach used in multiple epidemiological studies and is suggested as a method for obesity screening and early clinical assessment [9]. However, this fat index may have some shortcomings and miss details about local abdominal and metabolism disorders. Some studies suggest that the body’s fat distribution pattern plays a crucial role in determining risk factors for diseases [10].
Researches have shown that obesity troubles skeletal consistency and has tremendous consequences on skeletal anomalies. Being overweight induces bone and muscle problems, fatigue, low muscle strength and function, complications, and muscle discomfort [11]. Elevated body weight affects the body’s condition and dynamics, particularly in the spinal zone [12]. Obesity, therefore, influences cervical curvature. Backbone pain and anomalies are biomechanically related to insufficient load delivery in people with overweight [13]. Therefore, some behavioral and physiological parameters and effective interventions are essential, among the fundamental health considerations [14]. Physiological factors, including overweight and obesity, affects the skeletal structure and consequently the entire state of body [15]. Research shows that 40% of back pain induced by spinal anomalies is attributed to failure to maintain good posture and larger waist circumference [16]. However, the studies in this field have contradictory findings, and the history is unclear. In this context, De Souza et al. [13] stated that the prevalence of kyphosis in obese individuals compared with non-obese people is substantially different.
Kratěnová et al. [17] observed that high adipose tissue plays an important role in improving spinal stabilization. They also reported that in individuals with greater than normal body mass index developed the least frequent incidence of spinal anomalies [17]. Generally, the side-effects of obesity are commonly correlated with a wide variety of societal and economic costs every year, including higher health services, disabilities, early mortality, and decreased efficiency. Precise estimation of obesity in diverse populations based on established guidelines will help assess, manage, and avoid obesity and reduce these expenses. However, one of the difficulties is the disparity between the outcomes of different clinical trials. There is still dispute over the best obesity index forecasting the likelihood of cardiovascular diseases, and no firm conclusion has been reached yet. The majority of studies assessing the danger of obesity-related health effects have been carried out in Europe and the United States, and little research is available on this topic in countries in Asia, particularly Iran. Therefore, the basic anthropometric index to accurately screen chronic disease risk factors in every population is necessary. Experimental procedures require funding, resources, and expertise. This study aimed to evaluate the anthropometric indices in predicting overweight/obesity in male students in Iran.
2. Materials and Methods
This study was descriptive and analytical with a cross-sectional design. It was conducted from November 2019 to April 2020. An analytical cross-sectional study is a type of quantitative, non-experimental research design. These studies seek to gather data from a group of subjects at only one point at a time. The statistical population included all male students of Hakim Sabzevari University, Sabzevar City, Iran. A total of 162 students with an age range between 18 and 22 years were selected as a sample in a health monitoring plan using the available sampling method. First, the students were introduced to nature and research procedures. The inclusion criteria were non-drug use, non-smoking, with complete physical and mental health. The exclusion criteria included the history of any chronic diseases such as cardiovascular diseases, kidney diseases, rheumatology, and hereditary diseases. The subjects were voluntarily participated in the research based on the research conditions and signed the consent form. The required sample size was calculated from a Biomath sample size calculator with a significance level of ≤0.05, power of 85%, and 95% confidence interval. So, the required calculated sample size was 160 subjects.
In this study, to evaluate the body composition of the subjects, the height of the subjects was measured by seca (made in Germany) with a precision of 5 mm, hip and waist circumference with a tape measure (Mabis-Japan) with a precision of 5 mm, and weight by Beurer scales (made in Germany, model PS07-PS06). The BMI is defined as the body mass divided by the square of the body height and is universally expressed in kg/m². The Waist-to-Hip Ratio (WHR) is calculated by dividing waist measurement by hip measurement since the hip is the widest part of the buttocks. The formula is WHR= waist circumference/hip circumference. The Waist-to-Height Ratio (WHtR) was calculated by dividing the waist circumference by height. In this study, body mass index less than 18.5 is considered lean, between 18.5 and 24.9 normal, between 25 and 29.5 overweight, and equal to or more than 30 obese. For the waist variable was ≥0.94, waist to hip ratio was 0.9 ≥cm, and waist to height ratio was ≥0.5, which determines men’s overweight and obesity [18, 19].
To measure postural deformities, we used a chessboard. The middle line of the chessboard with a distinctive color was considered a plummet which is a framework with the dimensions of 100×200 cm, longitudinally and horizontally divided into 5-cm grid squares. The New York test and plummet were used for investigating forward head posture, rounded shoulder, kyphosis, scoliosis, flat back, and lordosis [20]. These tests are appropriate for determining any disorder in the lateral, posterior, and anterior sides [20]. Genu varum was determined by the executors given the gaps between ankle and knee. Flat feet were evaluated by measuring the foot arc height and hallux light from the foot length [20].
The collected data were analyzed in SPSS version 16.0. After reviewing the distribution, descriptive statistics were presented frequency, mean and standard deviation. However, to check the normal distribution of the obtained data, the Shapiro-Wilk test was used. In addition, 1-way ANOVA and a Receiver Operating Characteristic (ROC) curve analysis were used to analyze the data. ROC test was used to determine the best cut-off point of anthropometric indices using body mass index as a reference index. The cut-off point for BMI is 25 kg/m2, which indicates overweight [21]. The accuracy of the criteria for determining BMI was determined using the values of the Area Under the Curve (AUC). It is interpreted by the following criteria: no diagnostic value (AUC=0.05), low accuracy (0.5<AUC<0.7), moderate accuracy (0.7<AUC<0.9), high accuracy (0.9<AUC<1) and completely differentiating (AUC=1) [21]. The significance level was set at P<0.05.
3. Results
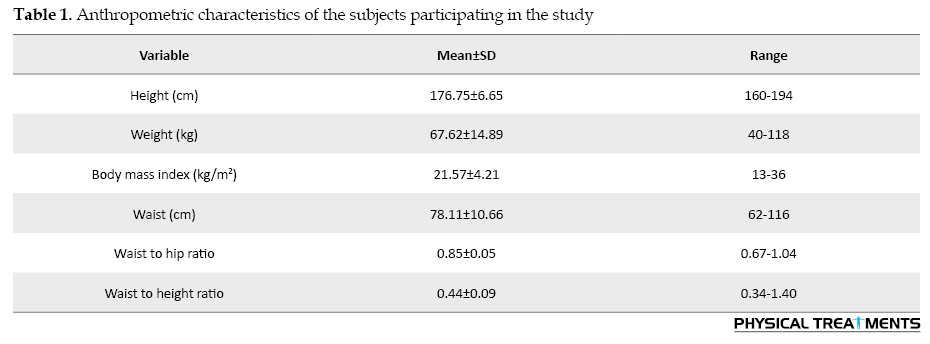
Table 1 presents the characteristics of the subjects and their anthropometric indices.
According to Table 2, the mean WC, WHR, WHtR in different groups of BMI was significant (P<0.05).
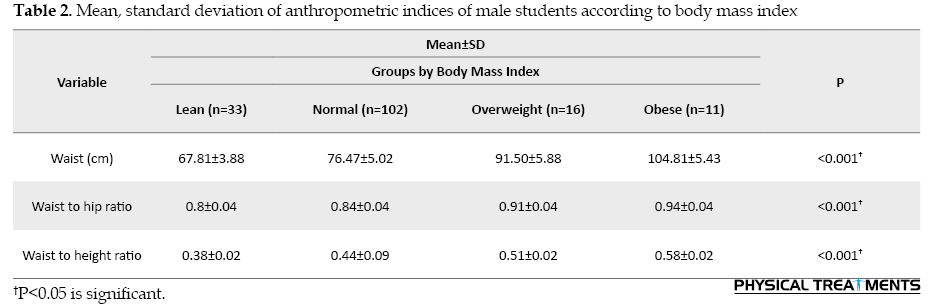
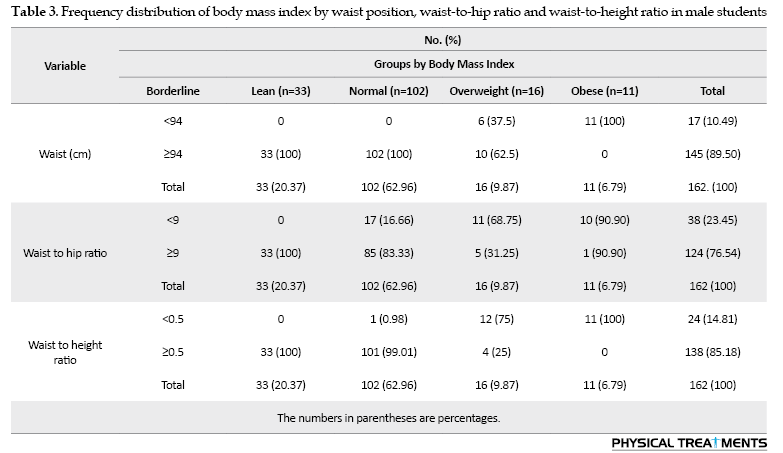
Table 3 summarizes the frequency distribution of body mass index of 162 samples in terms of waist circumference, waist-to-hip ratio, and waist-to-height ratio, i.e. 33 samples with body mass index <18.5 (lean), 102 samples with body mass index between 18.5-24.9 (normal), 16 samples with body mass index between 25-29.9 (overweight), and 11 samples with body mass index >30 (obese).
The ROC curve was used to determine the ability of WC, WHR, and WHtR as a tool to differentiate obesity in the subjects, and the accuracy of these variables in determining obesity was measured with AUC (Table 4). The AUC value of WC to differentiate between obese and normal-weight adolescents was 0.063 (P=0.001).
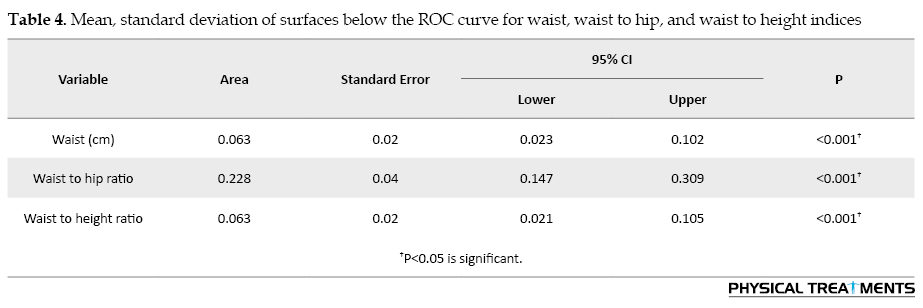
The AUC value for WHR was 0.228 (P=0.001), and the WHtR for the diagnosis of obesity was 0.063 (P=0.001). The area below the curve for the WHR was significantly higher than those of the WC and WHtR (P<0.05).
4. Discussion
Based on the present study results, the average WHR was considerably higher than WC and WHtR. Overall, the area under the curve for WHR is equivalent to 0.228, which suggests that overweight could be detected more effectively than other factors, including the WC and WHtR. In a longitudinal analysis, Dobbelsteyn et al. [18]found that BMI improvements in teenagers, particularly children with low BMI, do not accurately reflect body fat changes over time. BMI thus appears to be an appropriate technique to monitor obesity in teenagers. It should be mentioned that even with the same BMI, the WHR is very diverse, and it can be very distinctive [22]. Several reports have shown that Body Fat Percentage (BFP) and WHR impair BMI precision as an indicator of obesity [23, 24]. An analysis revealed that the diagnostic performance of WC is identical to BMI and stronger than WHtR [25]. Reilly et al. [26] demonstrated that the WC index has no additional benefit in detecting high-fat mass over the BMI index. Comparing WC and WHR with the BMI index in participants aged 20-58 years, Moy and Atiya [27] reported that the WC index throughout weight management is better than the WHR during obesity screening and may substitute BMI.
Nevertheless, the disparity in the measurement of waist circumference may be the main reason for these differences. For example, Mirzaei & Khajeh (2018) measured the waist circumference in the umbilical area, between the lowest region underneath the ribs and the iliac's upper part [28]. To measure the WC, we placed a tape measure around the body at the top of the hipbone. This level is usually at the level of the belly button. The variations in sample size, methods of body fat calculation, age of participants, statistical analysis, and criteria for body fat detection make it challenging to compare the findings of previous analyses. The heterogeneity of anthropometric indices may also be an explanation for the discrepancies in the findings. Only WC and WHR parameters were determined and compared in other analyses. Though in the current study, the WHtR was also evaluated as well as their relationships with BMI.
According to the present results, average values WC, WHR, and WHtR in various BMI communities are significantly different. The WHR overestimates the abdominal obesity index for overweight participants with large hip circumference, while this index is underestimated for lean participants with high WC. The biggest issue with using this index is that the hip and waist circumferences usually change a lot when weight is lost or gained. With weight gain, both scales are increasing together, and so the impact of weight gaining on this index is underestimated. This index is not appropriate for analyzing obesity, particularly changes in weight and its trend. The preservation and promotion of physical wellbeing are thus essential to alleviate the risk of obesity and associated illnesses, including cardiovascular diseases, hypertension, diabetes, obesity, and musculoskeletal abnormalities [29]. As the amount of physical exercise declines and muscle weakness rises, the composition of the human body and musculatures will deteriorate. This decline not only affects the organization and regular life of people in sporting events and offices but also harms the physical experiences of young participants psychologically and socially and may prevent them from engaging efficiently and positively in social and sporting settings. This is the commencement of a negative cycle in which such complications spread further throughout the group [30].
The use of a statistical ROC curve procedure was one of the advantages of this investigation. BMI was also recruited as the gold standard in this research to evaluate WHR. One of the primary limitations of some analyses is that the incision points used in obese and normal adolescent’s classification are not indigenous to each other. Also, measurement of subcutaneous fat is recommended to be investigated in future studies. Measuring this index requires only one tape measure, which is more economical than measuring height and weight and has fewer measurement errors. Another limitation of the study is the lack of control over lifestyle (amount of sleep, rest, and extracurricular activities), genetic, physiological characteristics, and various adaptation responses to physical activity. Since the change of such variables depends on the physical condition of individuals, coaches and sports physicians are advised to consider the necessary measures when designing interventions. In the future, we will expand our research scope and observation in our future studies.
5. Conclusion
Overall, this research suggests that the value of the AUC for WHR is 0.228, indicating its ability to detect overweight and obesity more efficiently than other factors, including WC and WHtR. The quantification of WHR is, though, more suitable than the two other variables because of its easy measurement and affordable expenses.
Ethical Considerations
Compliance with ethical guidelines
This study was approved by the Ethics Committee of the Hakim Sabzevari University (Code:IR-MEDSAB.REC.1398.972).
Funding
This research did not receive any grant from funding agencies in the public, commercial, or not-for-profit sectors.
Authors' contributions
Methodology: All authors; Conceptualization, implementation, data analysis, and writing-original draft: Keyvan Hejazi; Data analysis, writing – review & editing: Zahra Estiri.
Conflict of interest
The authors declared no conflicts of interest.
Acknowledgments
We want to thank the authorities of Hakim Sabzevari University for their assistance in this study.
Refrences:
Overweight and obesity cause life-threatening non-transmittable conditions, including cardiovascular disorders (heart attack and stroke), type 2 diabetes, some tumors, and so on [1]. Many authors identified microscopic index analysis as a realistic and easy way of measuring obesity and risk factors for heart disease [2, 3]. For this reason, they measure the body’s composition using the most significant clinical parameters, including the Body Mass Index (BMI), Waist Circumference (WC), hip circumference, Waist-to-Hip Ratio (WHR), and Waist-to-Height Ratio (WHtR) [4, 5].
Researchers have found that the Low-Density Lipoprotein Cholesterol (LDL-C) fat levels and the systolic and diastolic blood pressure of both genders are the strongest determinants [6, 7]. A significant independent medical parameter to identify vascular impairment is often abdominal obesity or the rise of the WHR. A cut-off point of cardiovascular risk factors is WHR ≥0.9 for males and ≥0.8 for females [8]. BMI is a popular and essential approach used in multiple epidemiological studies and is suggested as a method for obesity screening and early clinical assessment [9]. However, this fat index may have some shortcomings and miss details about local abdominal and metabolism disorders. Some studies suggest that the body’s fat distribution pattern plays a crucial role in determining risk factors for diseases [10].
Researches have shown that obesity troubles skeletal consistency and has tremendous consequences on skeletal anomalies. Being overweight induces bone and muscle problems, fatigue, low muscle strength and function, complications, and muscle discomfort [11]. Elevated body weight affects the body’s condition and dynamics, particularly in the spinal zone [12]. Obesity, therefore, influences cervical curvature. Backbone pain and anomalies are biomechanically related to insufficient load delivery in people with overweight [13]. Therefore, some behavioral and physiological parameters and effective interventions are essential, among the fundamental health considerations [14]. Physiological factors, including overweight and obesity, affects the skeletal structure and consequently the entire state of body [15]. Research shows that 40% of back pain induced by spinal anomalies is attributed to failure to maintain good posture and larger waist circumference [16]. However, the studies in this field have contradictory findings, and the history is unclear. In this context, De Souza et al. [13] stated that the prevalence of kyphosis in obese individuals compared with non-obese people is substantially different.
Kratěnová et al. [17] observed that high adipose tissue plays an important role in improving spinal stabilization. They also reported that in individuals with greater than normal body mass index developed the least frequent incidence of spinal anomalies [17]. Generally, the side-effects of obesity are commonly correlated with a wide variety of societal and economic costs every year, including higher health services, disabilities, early mortality, and decreased efficiency. Precise estimation of obesity in diverse populations based on established guidelines will help assess, manage, and avoid obesity and reduce these expenses. However, one of the difficulties is the disparity between the outcomes of different clinical trials. There is still dispute over the best obesity index forecasting the likelihood of cardiovascular diseases, and no firm conclusion has been reached yet. The majority of studies assessing the danger of obesity-related health effects have been carried out in Europe and the United States, and little research is available on this topic in countries in Asia, particularly Iran. Therefore, the basic anthropometric index to accurately screen chronic disease risk factors in every population is necessary. Experimental procedures require funding, resources, and expertise. This study aimed to evaluate the anthropometric indices in predicting overweight/obesity in male students in Iran.
2. Materials and Methods
This study was descriptive and analytical with a cross-sectional design. It was conducted from November 2019 to April 2020. An analytical cross-sectional study is a type of quantitative, non-experimental research design. These studies seek to gather data from a group of subjects at only one point at a time. The statistical population included all male students of Hakim Sabzevari University, Sabzevar City, Iran. A total of 162 students with an age range between 18 and 22 years were selected as a sample in a health monitoring plan using the available sampling method. First, the students were introduced to nature and research procedures. The inclusion criteria were non-drug use, non-smoking, with complete physical and mental health. The exclusion criteria included the history of any chronic diseases such as cardiovascular diseases, kidney diseases, rheumatology, and hereditary diseases. The subjects were voluntarily participated in the research based on the research conditions and signed the consent form. The required sample size was calculated from a Biomath sample size calculator with a significance level of ≤0.05, power of 85%, and 95% confidence interval. So, the required calculated sample size was 160 subjects.
In this study, to evaluate the body composition of the subjects, the height of the subjects was measured by seca (made in Germany) with a precision of 5 mm, hip and waist circumference with a tape measure (Mabis-Japan) with a precision of 5 mm, and weight by Beurer scales (made in Germany, model PS07-PS06). The BMI is defined as the body mass divided by the square of the body height and is universally expressed in kg/m². The Waist-to-Hip Ratio (WHR) is calculated by dividing waist measurement by hip measurement since the hip is the widest part of the buttocks. The formula is WHR= waist circumference/hip circumference. The Waist-to-Height Ratio (WHtR) was calculated by dividing the waist circumference by height. In this study, body mass index less than 18.5 is considered lean, between 18.5 and 24.9 normal, between 25 and 29.5 overweight, and equal to or more than 30 obese. For the waist variable was ≥0.94, waist to hip ratio was 0.9 ≥cm, and waist to height ratio was ≥0.5, which determines men’s overweight and obesity [18, 19].
To measure postural deformities, we used a chessboard. The middle line of the chessboard with a distinctive color was considered a plummet which is a framework with the dimensions of 100×200 cm, longitudinally and horizontally divided into 5-cm grid squares. The New York test and plummet were used for investigating forward head posture, rounded shoulder, kyphosis, scoliosis, flat back, and lordosis [20]. These tests are appropriate for determining any disorder in the lateral, posterior, and anterior sides [20]. Genu varum was determined by the executors given the gaps between ankle and knee. Flat feet were evaluated by measuring the foot arc height and hallux light from the foot length [20].
The collected data were analyzed in SPSS version 16.0. After reviewing the distribution, descriptive statistics were presented frequency, mean and standard deviation. However, to check the normal distribution of the obtained data, the Shapiro-Wilk test was used. In addition, 1-way ANOVA and a Receiver Operating Characteristic (ROC) curve analysis were used to analyze the data. ROC test was used to determine the best cut-off point of anthropometric indices using body mass index as a reference index. The cut-off point for BMI is 25 kg/m2, which indicates overweight [21]. The accuracy of the criteria for determining BMI was determined using the values of the Area Under the Curve (AUC). It is interpreted by the following criteria: no diagnostic value (AUC=0.05), low accuracy (0.5<AUC<0.7), moderate accuracy (0.7<AUC<0.9), high accuracy (0.9<AUC<1) and completely differentiating (AUC=1) [21]. The significance level was set at P<0.05.
3. Results
Table 1 presents the characteristics of the subjects and their anthropometric indices.
According to Table 2, the mean WC, WHR, WHtR in different groups of BMI was significant (P<0.05).
Table 3 summarizes the frequency distribution of body mass index of 162 samples in terms of waist circumference, waist-to-hip ratio, and waist-to-height ratio, i.e. 33 samples with body mass index <18.5 (lean), 102 samples with body mass index between 18.5-24.9 (normal), 16 samples with body mass index between 25-29.9 (overweight), and 11 samples with body mass index >30 (obese).
The ROC curve was used to determine the ability of WC, WHR, and WHtR as a tool to differentiate obesity in the subjects, and the accuracy of these variables in determining obesity was measured with AUC (Table 4). The AUC value of WC to differentiate between obese and normal-weight adolescents was 0.063 (P=0.001).
The AUC value for WHR was 0.228 (P=0.001), and the WHtR for the diagnosis of obesity was 0.063 (P=0.001). The area below the curve for the WHR was significantly higher than those of the WC and WHtR (P<0.05).
4. Discussion
Based on the present study results, the average WHR was considerably higher than WC and WHtR. Overall, the area under the curve for WHR is equivalent to 0.228, which suggests that overweight could be detected more effectively than other factors, including the WC and WHtR. In a longitudinal analysis, Dobbelsteyn et al. [18]found that BMI improvements in teenagers, particularly children with low BMI, do not accurately reflect body fat changes over time. BMI thus appears to be an appropriate technique to monitor obesity in teenagers. It should be mentioned that even with the same BMI, the WHR is very diverse, and it can be very distinctive [22]. Several reports have shown that Body Fat Percentage (BFP) and WHR impair BMI precision as an indicator of obesity [23, 24]. An analysis revealed that the diagnostic performance of WC is identical to BMI and stronger than WHtR [25]. Reilly et al. [26] demonstrated that the WC index has no additional benefit in detecting high-fat mass over the BMI index. Comparing WC and WHR with the BMI index in participants aged 20-58 years, Moy and Atiya [27] reported that the WC index throughout weight management is better than the WHR during obesity screening and may substitute BMI.
Nevertheless, the disparity in the measurement of waist circumference may be the main reason for these differences. For example, Mirzaei & Khajeh (2018) measured the waist circumference in the umbilical area, between the lowest region underneath the ribs and the iliac's upper part [28]. To measure the WC, we placed a tape measure around the body at the top of the hipbone. This level is usually at the level of the belly button. The variations in sample size, methods of body fat calculation, age of participants, statistical analysis, and criteria for body fat detection make it challenging to compare the findings of previous analyses. The heterogeneity of anthropometric indices may also be an explanation for the discrepancies in the findings. Only WC and WHR parameters were determined and compared in other analyses. Though in the current study, the WHtR was also evaluated as well as their relationships with BMI.
According to the present results, average values WC, WHR, and WHtR in various BMI communities are significantly different. The WHR overestimates the abdominal obesity index for overweight participants with large hip circumference, while this index is underestimated for lean participants with high WC. The biggest issue with using this index is that the hip and waist circumferences usually change a lot when weight is lost or gained. With weight gain, both scales are increasing together, and so the impact of weight gaining on this index is underestimated. This index is not appropriate for analyzing obesity, particularly changes in weight and its trend. The preservation and promotion of physical wellbeing are thus essential to alleviate the risk of obesity and associated illnesses, including cardiovascular diseases, hypertension, diabetes, obesity, and musculoskeletal abnormalities [29]. As the amount of physical exercise declines and muscle weakness rises, the composition of the human body and musculatures will deteriorate. This decline not only affects the organization and regular life of people in sporting events and offices but also harms the physical experiences of young participants psychologically and socially and may prevent them from engaging efficiently and positively in social and sporting settings. This is the commencement of a negative cycle in which such complications spread further throughout the group [30].
The use of a statistical ROC curve procedure was one of the advantages of this investigation. BMI was also recruited as the gold standard in this research to evaluate WHR. One of the primary limitations of some analyses is that the incision points used in obese and normal adolescent’s classification are not indigenous to each other. Also, measurement of subcutaneous fat is recommended to be investigated in future studies. Measuring this index requires only one tape measure, which is more economical than measuring height and weight and has fewer measurement errors. Another limitation of the study is the lack of control over lifestyle (amount of sleep, rest, and extracurricular activities), genetic, physiological characteristics, and various adaptation responses to physical activity. Since the change of such variables depends on the physical condition of individuals, coaches and sports physicians are advised to consider the necessary measures when designing interventions. In the future, we will expand our research scope and observation in our future studies.
5. Conclusion
Overall, this research suggests that the value of the AUC for WHR is 0.228, indicating its ability to detect overweight and obesity more efficiently than other factors, including WC and WHtR. The quantification of WHR is, though, more suitable than the two other variables because of its easy measurement and affordable expenses.
Ethical Considerations
Compliance with ethical guidelines
This study was approved by the Ethics Committee of the Hakim Sabzevari University (Code:IR-MEDSAB.REC.1398.972).
Funding
This research did not receive any grant from funding agencies in the public, commercial, or not-for-profit sectors.
Authors' contributions
Methodology: All authors; Conceptualization, implementation, data analysis, and writing-original draft: Keyvan Hejazi; Data analysis, writing – review & editing: Zahra Estiri.
Conflict of interest
The authors declared no conflicts of interest.
Acknowledgments
We want to thank the authorities of Hakim Sabzevari University for their assistance in this study.
Refrences:
- Khavari L, Nazem F, Farahpour N, Yousefian J. [The study of patterns of variation in body fat percent, BMI, body density and somatotype in girls aged between 13 and 17 in Hamadan (Persian)]. Harkat. 2007; 30(30):139-50. https://www.sid.ir/fa/journal/ViewPaper.aspx?ID=64318
- Gelber RP, Gaziano JM, Orav EJ, Manson JE, Buring JE, Kurth T. Measures of obesity and cardiovascular risk among men and women. Journal of the American College of Cardiology. 2008; 52(8):605-15. [DOI:10.1016/j.jacc.2008.03.066] [PMID] [PMCID]
- Flint AJ, Rexrode KM, Hu FB, Glynn RJ, Caspard H, Manson JE, et al. Body mass index, waist circumference, and risk of coronary heart disease: A prospective study among men and women. Obesity Research & Clinical Practice. 2010; 4(3):e171-81. [DOI:10.1016/j.orcp.2010.01.001] [PMID] [PMCID]
- Awad ET, Abd-alhamid AM, Ibrahem EE. Skinfold thickness, body mass index, waist to hip ratio, and waist to height ratio as a predictors measurements of common diseases such as diabetes mellitus, hypertension, and vitamin D deficiency. World Journal of Advanced Research and Reviews. 2020; 5(1):73-8. [DOI:10.30574/wjarr.2020.5.1.0001]
- Kumari S, Wang X, Liu Y, Gu Y, Huang Y, Zhang Q, et al. Height predict incident non-alcoholic fatty liver disease among general adult population in Tianjin, China, independent of body mass index, waist circumference, waist-to-height ratio, and metabolic syndrome. BMC Public Health. 2020; 20(1):388. [DOI:10.1186/s12889-020-08475-1] [PMID] [PMCID]
- Huang ZP, Huang BX, Zhang H, Zhu MF, Zhu HL. Waist-to-height ratio is a better predictor of hyperuricemia than body mass index and waist circumference in Chinese. Annals of Nutrition & Metabolism. 2019; 75(3):187-94. [DOI:10.1159/000504282] [PMID]
- Li N, Yang T, Yu WQ, Liu H. Is waist-to-height ratio superior to body mass index and waist circumference in predicting the incidence of hypertension? Annals of Nutrition & Metabolism. 2019; 74(3):215-23. [DOI:10.1159/000499073] [PMID]
- Liu J, Tse LA, Liu Z, Rangarajan S, Hu B, Yin L, et al. Predictive values of anthropometric measurements for cardiometabolic risk factors and cardiovascular diseases among 44048 Chinese. Journal of the American Heart Association. 2019; 8(16):e010870. [DOI:10.1161/JAHA.118.010870]
- Cornier MA, Despres JP, Davis N, Grossniklaus DA, Klein S, Lamarche B, et al. Assessing adiposity: A scientific statement from the American Heart Association. Circulation. 2011; 124(18):1996-2019. [DOI:10.1161/CIR.0b013e318233bc6a] [PMID]
- Esmaillzadeh A, Mirmiran P, Azizi F. Waist-to-hip ratio is a better screening measure for cardiovascular risk factors than other anthropometric indicators in Tehranian adult men. International Journal of Obesity and Related Metabolic Disorders. 2004; 28(10):1325-32. [DOI:10.1038/sj.ijo.0802757] [PMID]
- Akhmedov D, Berdeaux R. The effects of obesity on skeletal muscle regeneration. Frontiers in Physiology. 2013; 4:371. [DOI:10.3389/fphys.2013.00371] [PMID] [PMCID]
- Farahani A, Hoseini S, Aghayary A, Ghorbani Ghahfarokhi L. [The relation between body composition and spinal lordosis and kyphosis abnormalities in women (Persian)]. Journal of Research in Rehabilitation Sciences. 2012; 8(3):541-52. [DOI:10.22122/jrrs.v8i3.506]
- de Souza SAF, Faintuch J, Valezi AC, Sant’Anna AF, Gama-Rodrigues JJ, de Batista Fonseca IC, et al. Postural changes in morbidly obese patients. Obesity Surgery. 2005; 15(7):1013-6. [DOI:10.1381/0960892054621224] [PMID]
- Ghorbanpoor Z, Mosallanezhad Z, Minaee Javid J, Talimkhani A, Akbar Fahimi N. The relationship between the spine curvature disorders and the resting habits of university students. Physical Treatments. 2017; 7(2):97-102. https://ptj.uswr.ac.ir/article-1-338-en.pdf
- Rahmaninia F, Daneshmandi H. [Relationship between body weight and female students with lower limb abno-rmalities (Persian)]. Harkat. 2003; 33(33):31-45. https://joh.ut.ac.ir/article_19097.html
- Gates SJ. On-the-job back exercises. The American Journal of Nursing. 1988; 88(5):656-9. [DOI:10.2307/3425934] [PMID]
- Kratěnová J, ŽEjglicová K, Malý M, Filipová V. Prevalence and risk factors of poor posture in school children in the Czech Republic. The Journal of School Health. 2007; 77(3):131-7. [DOI:10.1111/j.1746-1561.2007.00182.x] [PMID]
- Dobbelsteyn CJ, Joffres MR, MacLean DR, Flowerdew G. A comparative evaluation of waist circumference, waist-to-hip ratio and body mass index as indicators of cardiovascular risk factors. The Canadian Heart Health Surveys. International Journal of Obesity and Related Metabolic Disorders. 2001; 25(5):652-61. [DOI:10.1038/sj.ijo.0801582] [PMID]
- Kamadjeu RM, Edwards R, Atanga JS, Kiawi EC, Unwin N, Mbanya JC. Anthropometry measures and prevalence of obesity in the urban adult population of Cameroon: An update from the Cameroon Burden of Diabetes Baseline Survey. BMC Public Health. 2006; 6:228. [DOI:10.1186/1471-2458-6-228] [PMID] [PMCID]
- Darzabi T, Nabavinik H, Saberi Najafi MM, Ghafari Noghondar Y, Hemati Ostad R, Faraz Farouji J, et al. Comparing the effect of eight weeks selected football practice and corrective movements on abnormalities and body composition in students. Physical Treatments. 2018; 8(3):133-42. [DOI:10.32598/ptj.8.3.133]
- Attarzadeh Hosseini SR, Mohammad Rahimi GR, Ghaemi J. [Compare waist circumference, waist-to-hip ratio and waist-to-stature ratio in predicting overweight/obese male students (Persian)]. Razi Journal of Medical Sciences. 2017; 24(161):67-76. http://rjms.iums.ac.ir/article-1-4889-en.html
- Widhalm K, Schönegger K, Huemer C, Auterith A. Does the BMI reflect body fat in obese children and adolescents? A study using the TOBEC method. International Journal of Obesity and Related Metabolic Disorders. 2001; 25(2):279-85. [DOI:10.1038/sj.ijo.0801511] [PMID]
- Freedman DS, Wang J, Maynard LM, Thornton JC, Mei Z, Pierson RN, et al. Relation of BMI to fat and fat-free mass among children and adolescents. International Journal of Obesity and Related Metabolic Disorders. 2005; 29(1):1-8. [DOI:10.1038/sj.ijo.0802735] [PMID]
- Palmer‐Hague JL, Twele AC, Fuller AJ. Body mass index, facial width‐to‐height ratio, and perceived formidability in female Ultimate Fighting Championship (UFC) fighters. Aggressive Behavior. 2018; 44(6):553-60. [DOI:10.1002/ab.21774] [PMID]
- Hubert H, Guinhouya CB, Allard L, Durocher A. Comparison of the diagnostic quality of body mass index, waist circumference and waist-to-height ratio in screening skinfold-determined obesity among children. Journal of Science and Medicine in Sport. 2009; 12(4):449-51. [DOI:10.1016/j.jsams.2008.05.002] [PMID]
- Reilly JJ, Dorosty AR, Ghomizadeh NM, Sherriff A, Wells JC, Ness AR. Comparison of waist circumference percentiles versus body mass index percentiles for diagnosis of obesity in a large cohort of children. International Journal of Pediatric Obesity. 2010; 5(2):151-6. [DOI:10.3109/17477160903159440] [PMID]
- Moy FM, Atiya A. Waist circumference as a screening tool for weight management: evaluation using receiver operating characteristic curves for Malay subjects. Asia Pacific Journal of Public Health. 2003; 15(2):99-104. [DOI:10.1177/101053950301500205] [PMID]
- Mirzaei M, Khajeh M. Comparison of anthropometric indices (body mass index, waist circumference, waist to hip ratio and waist to height ratio) in predicting risk of type II diabetes in the population of Yazd, Iran. Diabetes & Metabolic Syndrome: Clinical Research & Reviews. 2018; 12(5):677-82. [DOI:10.1016/j.dsx.2018.04.026] [PMID]
- Pasdar Y, Niazi P, Darbandi M, Khalvandi F, Izadi N. [Effect of physical activity on body composition and quality of life among women staff of Kermanshah University of Medical Sciences in 2013 (Persian)]. Journal of Rafsanjan University of Medical Sciences. 2015; 14(2):99-110. http://journal.rums.ac.ir/browse.php?a_id=2252&sid=1&slc_lang=en
- Moradporian MR, Rahmati M, Fouladvand M. [Study of abnormality frequency and its related factors in Khorramabad Azad university students (Persian)]. Yafteh. 2012; 14(4):113-20. http://yafte.lums.ac.ir/article-1-880-en.html
Type of Study: Research |
Subject:
General
Received: 2020/10/25 | Accepted: 2021/06/19 | Published: 2021/04/1
Received: 2020/10/25 | Accepted: 2021/06/19 | Published: 2021/04/1
Send email to the article author
| Rights and permissions | |
 |
This work is licensed under a Creative Commons Attribution-NonCommercial 4.0 International License. |
Physical Treatments (PTJ)
University of Social Welfare and Rehabilitation Sciences, Koodakyar Alley, Daneshjoo Blv., Evin, Tehran, Iran
Journal Office Tel: +9821 71732822
Publisher Tel: +9821 4535 5555, 4535 5000 (EXT: 108)
Email: physicaltreatments@gmail.com