Sat, Apr 20, 2024
Volume 9, Issue 3 (Summer 2019)
PTJ 2019, 9(3): 137-146 |
Back to browse issues page


Download citation:
BibTeX | RIS | EndNote | Medlars | ProCite | Reference Manager | RefWorks
Send citation to:


BibTeX | RIS | EndNote | Medlars | ProCite | Reference Manager | RefWorks
Send citation to:
Ghazaleh L, Saleh-Sedghpour B, Mohajerinejad N, Mansoobi E. Comparing Three Footprint Grades to Evaluate Footprint Indexes for Flat Foot Diagnosis. PTJ 2019; 9 (3) :137-146
URL: http://ptj.uswr.ac.ir/article-1-406-en.html
URL: http://ptj.uswr.ac.ir/article-1-406-en.html


1- Department of Sport Physiology, Faculty of Sport Sciences, Alzahra University, Tehran, Iran.
2- Department of Educational Sciences, Faculty of Humanities, Shahid Rajaii Teacher Training University, Tehran, Iran.
2- Department of Educational Sciences, Faculty of Humanities, Shahid Rajaii Teacher Training University, Tehran, Iran.
Full-Text [PDF 865 kb]
(2115 Downloads)
| Abstract (HTML) (2815 Views)


Full-Text: (1734 Views)
1. Introduction
Flat Foot (FF) is a nebulous mixture of anatomical variations as well as a small core of pathological conditions [1, 2]. Due to the nature of this deformity, there is no accepted universal description for it [2, 3]. FF deformity is clinically defined as any condition of the foot in which the Medial Longitudinal Arch (MLA) of foot is decreased or lost [4]. The logic behind such definition is that in all people with FF, MLA is changed as an anatomical structure [4-6].
There are indirect and direct methods for FF evaluation. Indirect methods include the ink or digital footprints. Direct methods consist of somatometric measurements, clinical assessments, and radiographic evaluations [7]. A footprint is among the most popular and widely used methods of assessing MLA. This method has been used in both research and clinical settings due to its inexpensiveness, simplicity, and time-saving properties [8]. Various footprint-based analyses for foot arch assessment have been developed in previous studies [9, 10]. Different analyses have resulted in the presentation of various indexes. Various indexes have left clinicians, and researchers confounded to no conclusive evidence to recognize the most practical footprint index in determining the foot arches [9]. As a result, they simultaneously used several indexes in most research studies on footprint for evaluating FF [11-13]. Therefore, part of investigations in the field of flat foot relates to selecting a proper index for using in footprint method [9, 14-18].
Chen et al. [18] compared values obtained from three indexes of Clarke’s Angle (CA) index, Chippaux-Smirak Index (CSI), and Staheli (ST) index, and Arch index. They revealed that the CSI had an anticipating probability of ˃90% and suggested it for FF screening in preschool-aged children. Pita-Fernández et al. [16] argued that between three indexes mentioned above, the CA is authentic for FF diagnosis in adults. Shariff et al. [9] compared 5 indexes (CA index, CSI, ST index, Arch index, and the Harris-imprint index). They concluded that Harris-imprint index was appropriate for specifying the left and right foot arches in adult women. Gonzalez et al. [17] compared CA and CSI and expressed that CA has limited sensitivity in diagnosing FF, using the CSI as a reference. Their results were contradictory and failed to select the proper index. Thus, this topic is still under investigation [19].
A careful look at the nature of footprint and its indexes may majorly help to solve the problem. In footprint method, any changes in the shape and orientation of structural components of the foot would be reflected in the imprint [10]. Therefore, two factors may distinguish the footprint-based indexes. The first one is regions and their relevant parameters, which have been considered in footprint indexes. The parameter indicates a measured factor on the specific region of contact area of foot plantar (i.e. forefoot, midfoot, and rearfoot), which is reflected on footprint. The matter that which region of foot plantar is reflected on footprint, and the extent of this reflection depends on the severity of deformity [9]. The less the deformity, the less the regions of plantar foot will be, which are contacted with ground. When MLA is gradually decreased, this contact is increased, and consequently, the shape of foot plantar changes in imprint. This can be the reason for different imprints obtained from individuals with flat foot [20, 21]. The second factor which distinguishes footprint-based indexes is the calculation method used in each index. The calculation methods can be based on obtained values from the ratio of two areas, ratio of two lines, or angle between two lines or other items [9].
Considering the above-mentioned points, the accurate index requires the following specifications: parameters applied in it should be based on regions in the foot which have been more affected by MLA height, and it should also apply more accurate calculations. Such index may be sensitive to the minimum decrease in the height of MLA. Studying plan and methodology used in previous research studies (as mentioned above) somewhat proves this issue. The researchers were seeking for an index sensitive to decrease the height of MLA among footprint indexes. Shariff et al. revealed in obese individuals in which the height of MLA decreases, the most sensitive index is the one which can demonstrate the difference of foot arches between left and right feet [9]. According to Gonzalez et al. [17], the most appropriate index is the one which its discordance with a reference index decreases as the Body Mass Index (BMI) values increase. Onodera et al. [15] concluded that the best index is the one that can detect deformity during growth (3-10 years of age) when FF gradually disappears.
Therefore, the previous researchers were aware that the most appropriate index is the one that is sensitive to minimum decrease in the height of MLA. However, some points are remarkable about variables in these studies. These studies indirectly measured the effect of independent variables on dependent variables. Indirectly measuring the effect of independent variable means that instead of grading MLA height, variables, such as obesity, BMI, and growth were evaluated. These are samples of related factors to FF deformity [15, 21]. MLA height decreases by increased obesity and BMI [21]. In addition, the studied dependent variables only included the quotient of calculations used in selected footprint indexes.
However, the present study aimed to increase the intensity of the independent variable effect on dependent variable. Footprints obtained from individuals with FF abnormality were graded in three grades of mild, moderate, and sever. Moreover, more diverse dependent variables which featured the nature of footprint index were investigated in the present study.
Considering the accurate index can detect the minimum decrease in MLA. Thus, we determined which index and parameters are suitable to detect mild FF. Moreover, we investigated whether the identified index and parameters could accurately diagnose mild FF.
2. Materils and Methods
To select the study samples, female students from Alzahra University who were a volunteer to participate in the study were screened for FF deformity through clinical assessment and footprint methods. In total, 148 feet (77 individuals) were selected as study samples. Moreover, some subjects had unilateral FF [8].
Inclusion criteria were the age of 18-25 years, having healthy BMI score [9], and no neuromuscular diseases. The study subjects were screened for FF in 2 stages. The first stage of the screening protocol involved clinical assessment. At clinical diagnosis of FF, the subjects were assessed at standing position. If one of the symptoms of decrease or disappearance of MLA, plantar-medial border convex, or hindfoot valgus was observed in foot, the subject entered the second stage of screening [22]. Individuals lacking the above-mentioned symptoms were excluded from the study. Other exclusion criteria were a history of foot or ankle surgery and a limb length discrepancy of ˃2 cm.
The second FF screening included the footprint test. To imprint plantar foot by footprint method, a hard surface saturated with ink and a white paper were used. Footprints acquisition was performed in the bipedal position with bilateral weight-bearing [15]. The ink print quality of the lateral foot contour ensured that the collected data were accurate. In case ink print quality was inappropriate, footprint test was repeated. After the plantar prints, foot arching parameters were determined based on 4 footprint indexes, including Sztriter-Godunov, CA, CSI, and ST. If at least one of the 4 above-mentioned indexes confirmed FF in the studied individuals in the previous stage (i.e. clinical assessment, the imprint of individual foot was entered into study as a proper item and was statistically analyzed; otherwise the individual was excluded from study). Therefore, another exclusion criterion was the lack of confirmation for FF by one of the 4 footprint indexes.
Footprint indexes and their associated parameters were calculated as follows:
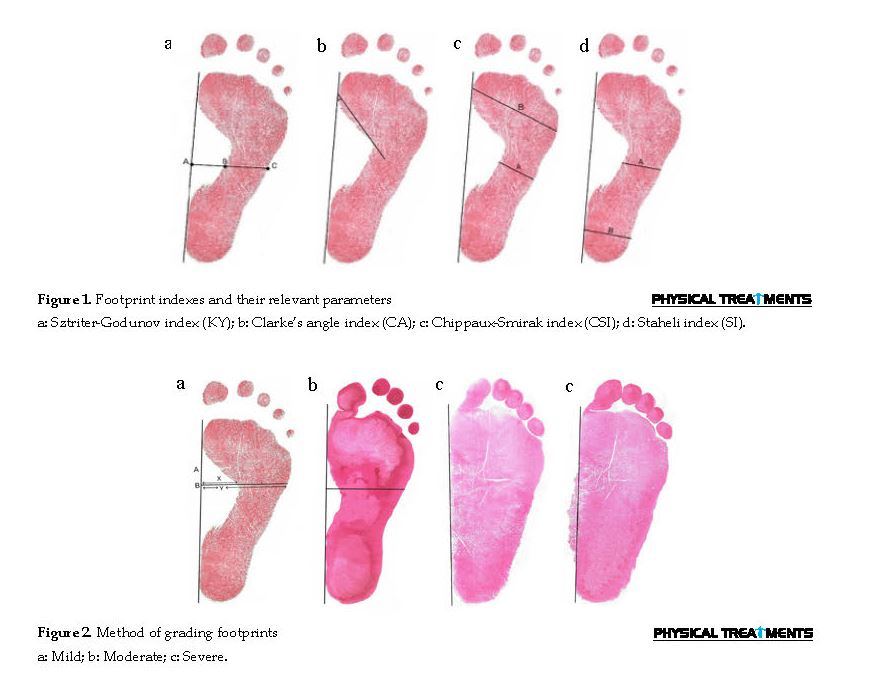
Sztriter-Godunov index (KY): KY index is comprised of two parameters and represents the ratio of the length of AB line to AC. AC is a line plumbed from the center of MLA to the medial border of foot [12]. AB line is defined as the distance from the center of MLA to the medial border of foot on the AC line (Figure 1). Based on this index, FF is present if the calculated number is ˃0.46 [19].
Clarke’s Angle (CA) index: CA index is measured by estimating the angle of a first medial tangential line that joins the medial edges of the first metatarsal head and the heel, and a second line that joins the first metatarsal head and the top of MLA concavity [18] (Figure 1). Based on this index, FF is present if the calculated number is <41º [19].
Chippaux-Smirak Index (CSI): CSI has two parameters and is specified as the ratio of line A to line B. Line A is a parallel line to B at the narrowest point on the foot arch. Line B is specified as the maximum width at the metatarsals [18] (Figure 1). Based on CSI, if the calculated number is <45, the individual has FF [23].
Staheli (ST) index: ST index includes two parameters and is the ratio between lines A and B. It denotes the minimum width of the midfoot and the maximum width of the hindfoot, respectively [24] (Figure 1). If the calculated number is ˃0.8, the individual has FF [25].
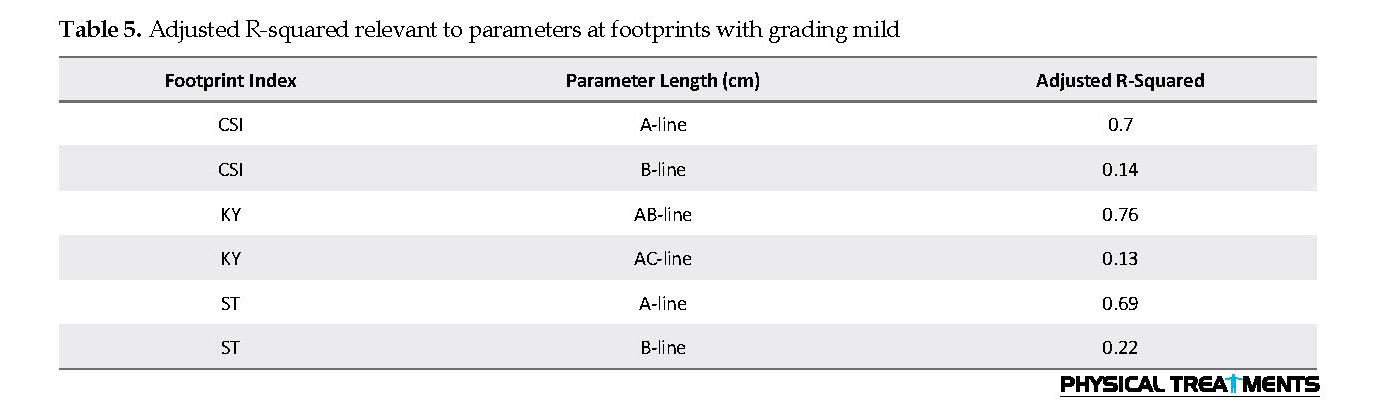
To quantitatively classify the grade of flatness of the arch in foot imprints, the ratio of the height of the MLA (x) to the width of the foot (y) along the line A was calculated. A perpendicular line (A) was drawn from the medial border of the foot (B) through the highest point of the MLA [26].
If x was up to y, the footprint was graded as mild. If x was less than y to the extreme that does not become zero, the footprint was graded as moderate. Finally, if the hollow region was 0 or the medial edge of foot turned convex, the footprint was graded as severe [1] (Figure 2). SPSS was used for statistical analysis. To investigate the internal consistency of measurements, Cronbach’s alpha coefficient was calculated. Exploratory factor analysis was used to identify proper components for the diagnosis of FF. By Multivariate Analysis of Variance (MANOVA), between-group differences were assessed. A Chi-squared test was used to identify the most accurate index for the diagnosis of mild FF. The significance level was set at P<0.05 for all statistical analyses.
Flat Foot (FF) is a nebulous mixture of anatomical variations as well as a small core of pathological conditions [1, 2]. Due to the nature of this deformity, there is no accepted universal description for it [2, 3]. FF deformity is clinically defined as any condition of the foot in which the Medial Longitudinal Arch (MLA) of foot is decreased or lost [4]. The logic behind such definition is that in all people with FF, MLA is changed as an anatomical structure [4-6].
There are indirect and direct methods for FF evaluation. Indirect methods include the ink or digital footprints. Direct methods consist of somatometric measurements, clinical assessments, and radiographic evaluations [7]. A footprint is among the most popular and widely used methods of assessing MLA. This method has been used in both research and clinical settings due to its inexpensiveness, simplicity, and time-saving properties [8]. Various footprint-based analyses for foot arch assessment have been developed in previous studies [9, 10]. Different analyses have resulted in the presentation of various indexes. Various indexes have left clinicians, and researchers confounded to no conclusive evidence to recognize the most practical footprint index in determining the foot arches [9]. As a result, they simultaneously used several indexes in most research studies on footprint for evaluating FF [11-13]. Therefore, part of investigations in the field of flat foot relates to selecting a proper index for using in footprint method [9, 14-18].
Chen et al. [18] compared values obtained from three indexes of Clarke’s Angle (CA) index, Chippaux-Smirak Index (CSI), and Staheli (ST) index, and Arch index. They revealed that the CSI had an anticipating probability of ˃90% and suggested it for FF screening in preschool-aged children. Pita-Fernández et al. [16] argued that between three indexes mentioned above, the CA is authentic for FF diagnosis in adults. Shariff et al. [9] compared 5 indexes (CA index, CSI, ST index, Arch index, and the Harris-imprint index). They concluded that Harris-imprint index was appropriate for specifying the left and right foot arches in adult women. Gonzalez et al. [17] compared CA and CSI and expressed that CA has limited sensitivity in diagnosing FF, using the CSI as a reference. Their results were contradictory and failed to select the proper index. Thus, this topic is still under investigation [19].
A careful look at the nature of footprint and its indexes may majorly help to solve the problem. In footprint method, any changes in the shape and orientation of structural components of the foot would be reflected in the imprint [10]. Therefore, two factors may distinguish the footprint-based indexes. The first one is regions and their relevant parameters, which have been considered in footprint indexes. The parameter indicates a measured factor on the specific region of contact area of foot plantar (i.e. forefoot, midfoot, and rearfoot), which is reflected on footprint. The matter that which region of foot plantar is reflected on footprint, and the extent of this reflection depends on the severity of deformity [9]. The less the deformity, the less the regions of plantar foot will be, which are contacted with ground. When MLA is gradually decreased, this contact is increased, and consequently, the shape of foot plantar changes in imprint. This can be the reason for different imprints obtained from individuals with flat foot [20, 21]. The second factor which distinguishes footprint-based indexes is the calculation method used in each index. The calculation methods can be based on obtained values from the ratio of two areas, ratio of two lines, or angle between two lines or other items [9].
Considering the above-mentioned points, the accurate index requires the following specifications: parameters applied in it should be based on regions in the foot which have been more affected by MLA height, and it should also apply more accurate calculations. Such index may be sensitive to the minimum decrease in the height of MLA. Studying plan and methodology used in previous research studies (as mentioned above) somewhat proves this issue. The researchers were seeking for an index sensitive to decrease the height of MLA among footprint indexes. Shariff et al. revealed in obese individuals in which the height of MLA decreases, the most sensitive index is the one which can demonstrate the difference of foot arches between left and right feet [9]. According to Gonzalez et al. [17], the most appropriate index is the one which its discordance with a reference index decreases as the Body Mass Index (BMI) values increase. Onodera et al. [15] concluded that the best index is the one that can detect deformity during growth (3-10 years of age) when FF gradually disappears.
Therefore, the previous researchers were aware that the most appropriate index is the one that is sensitive to minimum decrease in the height of MLA. However, some points are remarkable about variables in these studies. These studies indirectly measured the effect of independent variables on dependent variables. Indirectly measuring the effect of independent variable means that instead of grading MLA height, variables, such as obesity, BMI, and growth were evaluated. These are samples of related factors to FF deformity [15, 21]. MLA height decreases by increased obesity and BMI [21]. In addition, the studied dependent variables only included the quotient of calculations used in selected footprint indexes.
However, the present study aimed to increase the intensity of the independent variable effect on dependent variable. Footprints obtained from individuals with FF abnormality were graded in three grades of mild, moderate, and sever. Moreover, more diverse dependent variables which featured the nature of footprint index were investigated in the present study.
Considering the accurate index can detect the minimum decrease in MLA. Thus, we determined which index and parameters are suitable to detect mild FF. Moreover, we investigated whether the identified index and parameters could accurately diagnose mild FF.
2. Materils and Methods
To select the study samples, female students from Alzahra University who were a volunteer to participate in the study were screened for FF deformity through clinical assessment and footprint methods. In total, 148 feet (77 individuals) were selected as study samples. Moreover, some subjects had unilateral FF [8].
Inclusion criteria were the age of 18-25 years, having healthy BMI score [9], and no neuromuscular diseases. The study subjects were screened for FF in 2 stages. The first stage of the screening protocol involved clinical assessment. At clinical diagnosis of FF, the subjects were assessed at standing position. If one of the symptoms of decrease or disappearance of MLA, plantar-medial border convex, or hindfoot valgus was observed in foot, the subject entered the second stage of screening [22]. Individuals lacking the above-mentioned symptoms were excluded from the study. Other exclusion criteria were a history of foot or ankle surgery and a limb length discrepancy of ˃2 cm.
The second FF screening included the footprint test. To imprint plantar foot by footprint method, a hard surface saturated with ink and a white paper were used. Footprints acquisition was performed in the bipedal position with bilateral weight-bearing [15]. The ink print quality of the lateral foot contour ensured that the collected data were accurate. In case ink print quality was inappropriate, footprint test was repeated. After the plantar prints, foot arching parameters were determined based on 4 footprint indexes, including Sztriter-Godunov, CA, CSI, and ST. If at least one of the 4 above-mentioned indexes confirmed FF in the studied individuals in the previous stage (i.e. clinical assessment, the imprint of individual foot was entered into study as a proper item and was statistically analyzed; otherwise the individual was excluded from study). Therefore, another exclusion criterion was the lack of confirmation for FF by one of the 4 footprint indexes.
Footprint indexes and their associated parameters were calculated as follows:
Sztriter-Godunov index (KY): KY index is comprised of two parameters and represents the ratio of the length of AB line to AC. AC is a line plumbed from the center of MLA to the medial border of foot [12]. AB line is defined as the distance from the center of MLA to the medial border of foot on the AC line (Figure 1). Based on this index, FF is present if the calculated number is ˃0.46 [19].
Clarke’s Angle (CA) index: CA index is measured by estimating the angle of a first medial tangential line that joins the medial edges of the first metatarsal head and the heel, and a second line that joins the first metatarsal head and the top of MLA concavity [18] (Figure 1). Based on this index, FF is present if the calculated number is <41º [19].
Chippaux-Smirak Index (CSI): CSI has two parameters and is specified as the ratio of line A to line B. Line A is a parallel line to B at the narrowest point on the foot arch. Line B is specified as the maximum width at the metatarsals [18] (Figure 1). Based on CSI, if the calculated number is <45, the individual has FF [23].
Staheli (ST) index: ST index includes two parameters and is the ratio between lines A and B. It denotes the minimum width of the midfoot and the maximum width of the hindfoot, respectively [24] (Figure 1). If the calculated number is ˃0.8, the individual has FF [25].
To quantitatively classify the grade of flatness of the arch in foot imprints, the ratio of the height of the MLA (x) to the width of the foot (y) along the line A was calculated. A perpendicular line (A) was drawn from the medial border of the foot (B) through the highest point of the MLA [26].
If x was up to y, the footprint was graded as mild. If x was less than y to the extreme that does not become zero, the footprint was graded as moderate. Finally, if the hollow region was 0 or the medial edge of foot turned convex, the footprint was graded as severe [1] (Figure 2). SPSS was used for statistical analysis. To investigate the internal consistency of measurements, Cronbach’s alpha coefficient was calculated. Exploratory factor analysis was used to identify proper components for the diagnosis of FF. By Multivariate Analysis of Variance (MANOVA), between-group differences were assessed. A Chi-squared test was used to identify the most accurate index for the diagnosis of mild FF. The significance level was set at P<0.05 for all statistical analyses.

3. Results
The number of subjects in each group, their height, weight, and BMI scores are presented in Table 1.
Bartlett’s test of sphericity and the Kaiser-Meyer-Olkin (KMO) measure of sampling adequacy were applied (Table 2). As per Table 2, the value of KMO was ˃0.6. Therefore, the sample volume for exploratory factor analysis was sufficient. The value of Bartlett’s test of sphericity was also significant for the obtained data (P=0.000); therefore, we could use correlation analysis.
The internal consistency of footprint indexes of all data was obtained using Cronbach’s alpha coefficient. The relevant data revealed an error in the calculations of the CA index. The value of Cronbach’s alpha coefficient considering 4 footprint indexes was equal to 0.12; however, by omitting values relevant to CA index, the values of this coefficient increased to 0.77. Therefore, CA index was omitted, and its relevant values were not considered in further analysis (i.e. exploratory factor analysis, and multivariate analysis).
Data relevant to 6 parameters of the three indexes, i.e. CSI, KY, and ST, were analyzed through exploratory factor analysis. Results relevant to total variance are presented in Table 3. Such data revealed that the present study had identified 4 components based on the parameters of three measured indexes (CSI, KY, and ST), which explains 81% of the total parameters. Furthermore, the fourth parameter may not be formed due to its small value and it’s explained variance (9.56%). The Rotated Component Matrix (RCM) analysis results (Table 4) confirms this matter. As per Table 4, the fourth component is composed of 2 items; 2 items may not be the identifier of one component. Thus, only three components are formed based on the parameters of selected indexes.
Table 4 indicates that the first component, which includes items 1 to 6 is the identifier of parameters of CSI, KY, and ST indexes in footprints, which are graded as severe. Moreover, the least factor loading related to each of these parameters in this component was ˃0.8. The second component includes items 7 to 12. These items are the identifier of parameters of CSI, KY, and ST indexes in footprints, which are graded as moderate. The least factor loading related to each of these parameters in this component was ˃0.75. Finally, the last component included 5 items. Items 13-17 in the third component were the identifiers of parameters of CSI, KY, and ST indexes in footprints, which were graded as mild. The maximum factor loading in the third component was 0.9; therefore, two parameters of 16 and 17 can be omitted from this component.
MANCOVA results revealed that the linear combination of parameters of CSI, KY, and ST indexes with grade mild differs between the three study groups. Considering MANCOVA results and Roy’s most significant root difference between groups (F=115.97, df= 6 and 141) was significant (P<0.01). Such information represents that the independent variable of the present study (i.e. grading footprints into 3 classifications of mild, moderate, and severe) was effective on this linear combination (Table 5) for up to 83.1%. Among parameters presented in Table 5, adjusted R-squared of three parameters of A-line in CSI index, AB-line in KY index, and A-line in ST index were 0.7, 0.76 and 0.69, respectively. Those were more important than the other parameters.
The number of flatfoots which their flatness was confirmed or rejected by each index of ST, KY, and CSI is presented in Table 6. It is unclear which index has been able to carefully indicate the flatness of foot, especially in the mild group. This matter was investigated using Chi-squared test. Table 7 demonstrates that KY and ST indexes are significant with Chi-squared values equal to 44.08 and 8.33, respectively. However, Chi-square value related to KY was higher than ST, and KY index was more accurate than ST index in the diagnosis of FF. Therefore, despite the significance of ST, KY index is considered as a more proper index for FF diagnosis.
4. Discussion
The present study investigated which footprint index and its relevant parameters were more appropriate for the diagnosis of FF, especially in cases of mild deformity.
The obtained results revealed that in calculations of the CA index, there was measurement errors. Exploratory factor analysis based on the parameters of footprint indexes identified three critical components. Two identified components were based on the 6 parameters of CSI, KY, and ST indexes in moderate and severe footprints. The third component was related to footprints with mild grading and was composed of three extracted parameters from midfoot region. One important finding was that the linear combination of the three last parameters indicated significant differences between three groups. The last finding was that KY index could identify the highest number of flatfoots in the mild group.
As stated above, there was an error in the calculations of the CA index. Therefore, among calculations conducted in 4 selected indexes, the calculations of CA index had less reliability compared to other three indexes. CA is an index which its calculation is based on determining angle and is entirely different from other indexes. Calculation error could be due to the line which is drawn from the first metatarsal head to the top of the MLA concavity, i.e. the distal point of MLA. The important matter about the top of MLA concavity is that as the arch drop increases, the top of the MLA concavity disappears. Therefore, this point is not apparent in some footprints. This issue can be observed in Figure 2. Previous researchers exploring the selection of proper index to evaluate FF also concluded that the CA index was inappropriate [9, 17, 18].
Analysis of three remaining indexes, CSI, KY, and ST, and their parameters revealed that all 6 parameters (all three indexes, accordingly) were appropriate for the diagnosis of FF at severe and moderate gradings. However, it is unclear which parameters and index are proper for the diagnosis of mild FF. The present study suggested that among 6 parameters studied, 3 that were extracted from midfoot region were appropriate for the diagnosis of mild FF. Studying the anatomical structure of MLA in this regard can confirm this finding. MLA is composed of the bones of calcaneus, talus, navicular, the three cuneiforms, and first three metatarsals. Gwani et al. reported that navicular height decreases when the height of MLA decreases [27]. The summit of MLA is talocalcaneonavicular joint [28]. This joint is located at midfoot; midfoot is a region sensitive to minimum decrease in MLA. Thus, indexes which their parameters are extracted from this region can be appropriate for flat foot diagnosis. Among studied footprint indexes in the present study, KY index’s both parameters were extracted from midfoot. Therefore, KY can be a proper index for the diagnosis of mild FF. KY index was the only index that could detect 47 footprint indexes out of 48 with mild grading as FF. Scrutinized evaluation of the results of Sharrif et al. study [9] indicated that a proper index’s parameters are extracted from midfoot. Because they argued that among CA index, CSI, ST index, Arch index, and the Harris-imprint index, Harris-imprint index was appropriate in determining the left and right foot arches. The remarkable point is that Harris-imprint’s two parameters are extracted from midfoot.
Consequently, the present study findings revealed that the proper footprint index for the diagnosis of FF is the one that can detect minimum decrease of MLA (i.e. mild deformity). Because when the height of arch is moderate or when it is completely low, all indexes identify flatness in foot. Moreover, indexes which parameters are extracted from midfoot region can be proper for the diagnosis of mild FF. KY index’s both parameters are extracted from midfoot, and given that KY could identify several remarkable mild flatfoots in comparison with other indexes, we can introduce it as a proper index. To confirm the study results, it is necessary to identify individuals with mild flat feet through a gold standard method; then, analyze their footprints using KY method. One of the limitations of the present study was the failure to use a gold standard method to confirm the KY index as the most appropriate index in the diagnosis of mild flat foot deformity.
Study findings revealed that indexes which their related parameters were extracted from the midfoot region could be suitable for the diagnosis of mild flatfoot. KY index’s parameters were extracted from midfoot. Considering that KY could identify several remarkable mild flatfoots in comparison with other indexes, we can introduce it as a proper index.
Ethical Considerations
Compliance with ethical guidelines
There was no ethical considerations to be considered in this research.
Funding
This research did not receive any specific grant from funding agencies in the public, commercial, or not-forprofit sectors
Authors' contributions
Study concept and design: Leila Ghazaleh, Neda Mohajerinejad, Elnaz Mansoobi; Methodology: Leila Ghazaleh, Elnaz Mansoobi, Neda Mohajerinejad; Investigation: Leila Ghazaleh, Neda Mohajerinejad, Elnaz Mansoobi; Interpretation of data: Bahram Saleh-Sedghpour, Leila Ghazaleh; Writing review and editing: Leila Ghazaleh, Bahram Saleh-Sedghpour.
Conflict of interest
The authors declared no conflicts of interest.
References
Rose G, Welton E, Marshall T. The diagnosis of flat foot in the child. The Journal of Bone and Joint Surgery British Volume. 1985; 67(1):71-8. [DOI:10.1302/0301-620X.67B1.3968149] [PMID]
Carr JB, Yang S, Lather LA. Pediatric pes planus: A state-of-the-art review. Pediatrics. 2016; 137(3):e20151230. [DOI:10.1542/peds.2015-1230] [PMID]
Atik A, Ozyurek S. Flexible flatfoot. Northern Clinics of Istanbul. 2014; 1(1):57-64. [DOI:10.14744/nci.2014.29292] [PMID] [PMCID]
Kim H, Weinstein S. Flatfoot in children: Differential diagnosis and management. Current Orthopaedics. 2000; 14(6):441-7. [DOI:10.1054/cuor.2000.0156]
Gilmour JC, Burns Y. The measurement of the medial longitudinal arch in children. Foot & Ankle International. 2001; 22(6):493-8. [DOI:10.1177/107110070102200607] [PMID]
Kanatli U, Yetkin H, Cila E. Footprint and radiographic analysis of the feet. Journal of Pediatric Orthopaedics. 2001; 21(2):225-8. [DOI:10.1097/01241398-200103000-00018] [PMID]
Woźniacka R, Bac A, Matusik S, Szczygieł E, Ciszek E. Body weight and the medial longitudinal foot arch: High-arched foot, a hidden problem? European Journal of Pediatrics. 2013; 172(5):683-91. [DOI:10.1007/s00431-013-1943-5] [PMID] [PMCID]
Plumarom Y, Imjaijitt W, Chaiphrom N. Comparison between Staheli index on Harris mat footprint and Talar-first metatarsal angle for the diagnosis of flatfeet. Journal of The Medical Association of Thailand. 2014; 97 (Suppl. 2):S131-5.
Shariff SM, Manaharan T, Shariff AA, Merican AF. Evaluation of foot arch in adult women: Comparison between five different footprint parameters. Sains Malaysiana. 2017; 46(10):1839-48. [DOI:10.17576/jsm-2017-4610-22]
Razeghi M, Batt ME. Foot type classification: A critical review of current methods. Gait & Posture. 2002; 15(3):282-91. [DOI:10.1016/S0966-6362(01)00151-5]
Głowacka-Mrotek I, Sowa M, Siedlecki Z, Nowikiewicz T, Hagner W, Zegarski W. Evaluation of changes to foot shape in females 5 years after mastectomy: A case-control study. Breast Cancer Research and Treatment. 2017; 163(2):287-94. [DOI:10.1007/s10549-017-4183-y] [PMID] [PMCID]
Dzięcioł Z, Kuryliszyn-Moskal A, Dzięcioł J. Application of plantography examination to the assessment of foot deformity in patients with rheumatoid arthritis. Archives of Medical Science. 2015; 11(5):1015-20. [PMID] [PMCID]
Weber-Rajek M, Lulińska-Kuklik E, Goch A. The positive role of kinesio taping in adjunctive therapy of static plano-valgus feet in children between the ages of 5 and 7. Baltic Journal of Health and Physical Activity. 2017; 9(2):89-97.
Shiang T-Y, Lee S-H, Lee S-J, Chu WC. Evaluating different footprints parameters as a predictor of arch height. IEEE Engineering in Medicine and Biology Magazine. 1998; 17(6):62-6. [DOI:10.1109/51.731323] [PMID]
Onodera AN, Sacco ICN, Morioka EH, Souza PS, de Sá MR, Amadio AC. What is the best method for child longitudinal plantar arch assessment and when does arch maturation occur? The Foot. 2008; 18(3):142-9. [DOI:10.1016/j.foot.2008.03.003] [PMID]
Pita-Fernández S, González-Martín C, Seoane-Pillado T, López-Calviño B, Pértega-Díaz S, Gil-Guillén V. Validity of footprint analysis to determine flatfoot using clinical diagnosis as the gold standard in a random sample aged 40 years and older. Journal of Epidemiology. 2015; 25(2):148-54. [DOI:10.2188/jea.JE20140082] [PMID] [PMCID]
Gonzalez-Martin C, Pita-Fernandez S, Seoane-Pillado T, Lopez-Calviño B, Pertega-Diaz S, Gil-Guillen V. Variability between Clarke’s angle and Chippaux-Smirak index for the diagnosis of flat feet. Colombia Médica. 2017; 48(1):25-31. [DOI:10.25100/cm.v48i1.1947] [PMID]
Chen KC, Yeh CJ, Kuo JF, Hsieh CL, Yang SF, Wang CH. Footprint analysis of flatfoot in preschool-aged children. European Journal of Pediatrics. 2011; 170(5):611-7. [DOI:10.1007/s00431-010-1330-4] [PMID]
Bibrowicz K, Szurmik T, Michnik R, Wodarski P, Myśliwiec A, Mitas A. Application of Zebris dynamometric platform and arch index in assessment of the longitudinal arch of the foot. Technology and Health Care. 2018; 26(S2):543-51. [DOI:10.3233/THC-182501] [PMID]
Riccio I, Gimigliano F, Gimigliano R, Porpora G, Iolascon G. Rehabilitative treatment in flexible flatfoot: A perspective cohort study. Musculoskeletal Surgery. 2009; 93(3):101. [DOI:10.1007/s12306-009-0037-z] [PMID]
Chang JH, Wang SH, Kuo CL, Shen HC, Hong YW, Lin LC. Prevalence of flexible flatfoot in Taiwanese school-aged children in relation to obesity, gender, and age. European Journal of Pediatrics. 2010; 169(4):447-52. [DOI:10.1007/s00431-009-1050-9] [PMID]
Pfeiffer M, Kotz R, Ledl T, Hauser G, Sluga M. Prevalence of flat foot in preschool-aged children. Pediatrics. 2006; 118(2):634-9. [DOI:10.1542/peds.2005-2126] [PMID]
Mihai A, Pastina M. Classification of foot types, based on plantar footprint. Paper presented at 4th International Conference on Advanced Materials and Systems. Bucharest, Romania, 12 September 2012.
Maestre-Rendon J, Rivera-Roman T, Sierra-Hernandez J, Cruz-Aceves I, Contreras-Medina L, Duarte-Galvan C, et al. Low computational-cost footprint deformities diagnosis sensor through angles, dimensions analysis and image processing techniques. Sensors. 2017; 17(11):2700. [DOI:10.3390/s17112700] [PMID] [PMCID]
Soper C, Hume P, Cheung K, Benschop A. Foot morphology of junior football players: Implications for football shoe design. InA sports medicine odyssey-challenges, controversies and change. Paper presented at: Australian Conference of Science and Medicine in Sport, Perth, Australia, 7 October 2001.
Morley A. Knock-knee in children. British Medical Journal. 1957; 2(5051):976-79. [DOI:10.1136/bmj.2.5051.976] [PMID] [PMCID]
Gwani AS, Asari MA, Ismail ZM. How the three arches of the foot intercorrelate. Folia Morphologica. 2017; 76(4):682-8. [DOI:10.5603/FM.a2017.0049] [PMID]
Ashok A, Kulkarni M, Gandotra A. Quantitative morphology of Medial Longitudinal Arch among young Indian adults. Indian Journal of Clinical Anatomy and Physiology. 2017; 4(2):212-7. [DOI:10.18231/2394-2126.2017.0052]
Type of Study: Research |
Subject:
Special
Received: 2019/01/10 | Accepted: 2019/04/23 | Published: 2019/07/1
Received: 2019/01/10 | Accepted: 2019/04/23 | Published: 2019/07/1
Send email to the article author
| Rights and permissions | |
 |
This work is licensed under a Creative Commons Attribution-NonCommercial 4.0 International License. |
Physical Treatments (PTJ)
University of Social Welfare and Rehabilitation Sciences, Koodakyar Alley, Daneshjoo Blv., Evin, Tehran, Iran
Journal Office Tel: +9821 71732822
Publisher Tel: +9821 4535 5555, 4535 5000 (EXT: 108)
Email: physicaltreatments@gmail.com