Sat, Apr 20, 2024
Volume 7, Issue 2 (Summer 2017)
PTJ 2017, 7(2): 63-70 |
Back to browse issues page


Download citation:
BibTeX | RIS | EndNote | Medlars | ProCite | Reference Manager | RefWorks
Send citation to:


BibTeX | RIS | EndNote | Medlars | ProCite | Reference Manager | RefWorks
Send citation to:
Nourai Sajou S, Ansari H, Asgari Ashtiani A R. Investigation of Quality Gap in Physiotherapy Services in Public Clinics in Zahedan City, Iran Using SERVQUAL Model. PTJ 2017; 7 (2) :63-70
URL: http://ptj.uswr.ac.ir/article-1-303-en.html
URL: http://ptj.uswr.ac.ir/article-1-303-en.html


1- Insurance of Health, Saravan, Iran.
2- Department of Epidemiology and Bistatistics, Faculty of Public Health, Zahedan University of Medical Sciences, Zahedan , Iran.
2- Department of Epidemiology and Bistatistics, Faculty of Public Health, Zahedan University of Medical Sciences, Zahedan , Iran.
Full-Text [PDF 536 kb]
(1878 Downloads)
| Abstract (HTML) (5077 Views)


Full-Text: (1553 Views)
1. Introduction
urrently, the international community has allocated a specific priority over the quality of the product and better services. Low quality goods and services always make the consumers gradually lose their trust and confidence towards the suppliers of goods and providers of services. Finally, dissatisfaction and negative propaganda provide the ground for the destruction of the producer or service provider. Therefore, product quality has a strategic value in any company [1]. Although the issue of quality is widely regarded in the fields of production and industry, it has scarcely been addressed in the service sector due to its nature, i.e., the invisibility of the service. However, many fields in the service sector exist in which the concepts of quality and quality management can be designed and implemented, thereby, taking an effective action to improve the methods of service and customer satisfaction.
Traditional attitudes define quality based on the characteristics of goods or services. According to new methods and approaches, however, quality is defined as the demands of customers. Quality is not determined nor defined by the service-provider organizations; the customers rather determine the quality [2]. Parasuraman et al. defined service quality as “what the customers have understood” denoting that quality arises from a comparison between the expectations of services they receive with their perceptions of the performance of service providers [3].
American theorists mention four characteristics as the essence of an ideal management, one of which is to accept the fact that perceptions and expectations of customers are the main factors determining the quality [4]. Chin and Pun presented a model for the quality improvement of services and indicate feedback from customers as one of the essential steps. The feedbacks received from customers helps prioritize areas in need for continuous improvement, taking into account the limitations of time, resources, and other factors [5].
According to one study, the quality of services can be defined and measured through comparison of customer expectations and perceptions with the service performance. Thus, if perceptions surpass expectations, the service seems to be of a high quality and vice versa [6]. However, there is often no congruence between the management knowledge of consumers’ perceptions and expectations and their actual expectations and perceptions, which can damage the quality of services [6].
The first basic step is to recognize the customers’ perceptions and expectations of service quality and determine the quality gap followed by adopting strategies to reduce the gap and satisfy the customers. In this case, not only conscious prioritizing and strategic resource allocation are facilitated, but also a basis is provided to improve the quality and effectiveness of services. Thereby, proper understanding of customers’ expectations as well as their perceptions of the services provided allow the managers to establish their judgment and actions based on the facts and not on suppositions [7]. Quality has several dimensions. Zeithmal et al. conducted a study on the dimensions of quality. Based on their results, the main dimensions of service quality are as follows [3].
1. Reliability of the service: The ability to perform the service reliably so that it fulfils the expectations of the customer. Another sense of reliability is to fulfil obligations; 2. Responsiveness: Responsibility or accountability means the willingness to cooperate and assist with the customer. This dimension of service quality emphasizes on showing sensitivity and awareness regarding requests, inquiries, and complaints of customers; 3. Assurance: Warranty and guarantee demonstrate the competency of staff to induce a sense of confidence to the customer; 4. Empathy: Empathy means that people are specially dealt with according to their individual mentality so that customers are convinced that agencies value them for the organization; and 5. Tangible dimension. This dimension includes the availability of facilities, equipment, staff, and communication channels. All of these aspects provide an image taken into account by customers (especially new customers) to assess the quality.
Parasuraman et al. developed a tool using five dimensions of service quality to evaluate service quality from the customers’ viewpoints. The tool is called SERVQUAL in the quality literature and has been developed to measure quality based on perceptions and expectations of customers in a wide range of services whereas other tools of measuring service quality are applicable in appraising only one kind of service. The degree of difference between customers’ expectations and perceptions of the service provided is called the service quality gap [8]. The service delivery process can be improved by determining the gap between perceptions and expectations of customers; thereby, customer satisfaction is achieved as a very sensitive element in today’s competitive world. In other words, the quality of the services can be obtained through evaluation of their effectiveness [8].
Both national and international studies have been carried out in this field, so a few cases are noted below. Gholami et al. studied the quality gap in primary health care using SERVQUAL questionnaire in Urmia health centers [9]. Kebriaie et al. also evaluated the quality gap in primary health care in Kashan health centers [10]. Tarrahi et al. examined the quality of health services provided in Khorramabad health centers using SERVQUAL [11]. Zarei et al. conducted a study on patients admitted to private hospitals in Iran to evaluate the service qualities [12]. Campbell et al. studied the quality of primary health care services provided to patients in London health centers [13]. Lim and Tang assessed the quality of services provided at hospitals through examining the patients’ perceptions and expectations [14]. Caridys studied the expectations and perceptions of dental services qualities in Greek patients [15]. Mehrizi et al. (2013) investigated the quality of physiotherapy services in the physiotherapy clinics of university hospitals in Malaysia [16].
Among rehabilitation services, those concerned with physiotherapy have a special position because of many positive changes to treat a range of diseases, which are gaining growing interest due to lack of side effects (as those exist in medicinal treatment) [17]. Obviously, the quality of physiotherapy services provided to patients is of great importance; the higher the quality of physiotherapy services offered to the patients, the better the health of the society will be. Considering the importance of knowing patients’ viewpoints in improving the quality of physiotherapy services and eliminating or reducing the gap between the current and desired status of quality, little research on physiotherapy services in Iran as well as lack of relevant studies in the city of Zahedan, this study aimed at examining the quality gap in physiotherapy services based on the patients’ perceptions and expectations.
2. Materials and Methods
This cross-sectional study was carried out on the patients referred to the government physiotherapy clinics in Zahedan from July 2015 April 2016. A sample size of 240 individuals was determined using available related studies. After the sample size was determined, according to the list of patients per clinic, a simple random sampling method was executed using random numbers. The number of samples per clinic was determined as a quota. Based on the experience, relatively greater numbers of patients were selected among those referred at an earlier time in the clinics with higher counts of patients.
To collect the data, two kinds of questionnaires were used; demographic profile of patients and the standard SERVQUAL questionnaire. The latter has five dimensions of service quality (tangibility, reliability, responsiveness, assurance, and empathy). Then the reliability and validity of the questionnaire were assessed. In this regard, the questionnaire was sent to a number of experts in this field and approved with certain modifications. In order to determine the reliability, first the prepared questionnaire was given to 30 patients referred to the clinic. The Persian SERVQUAL questionnaire showed statistically significant good convergent validity. The Cronbach α coefficient for the Persian SERVQUAL questionnaire was found to be 86%. The Persian SERVQUAL questionnaire components showed good to excellent test-retest reliability with intraclass correlation coefficient range from 0.73 to 0.84 (P<0.01).
The inclusion criteria included both male and female outpatients referred to clinics, and those who had spent at least five therapy sessions [16]. The exclusion criteria included patients who were admitted at different wards and also illiterate patients who were unable to speak.
The questionnaire has 22 questions in which tangibility, reliability and responsiveness each has four questions, and assurance and empathy five questions. The questions were scored from 1 to 5. Score 1 indicates “very bad” and 5 refers to “very good” situation with regard to the perceptions part. In the expectations section, 1 refers to “very unimportant” and 5 to “very important” conditions. To determine the quality gap, the patients’ scores concerning the quality of present physiotherapy services (their perceptions of the quality of services provided) were compared with their scores of the quality of optimal physiotherapy services (their expectations of the service quality). If the resultant score was positive, it would indicate that provided physiotherapy services exceeded the expectations of patients. A negative score would mean that the provided physiotherapy services did not meet their expectations, hence, there is a quality gap. A score of 0 was considered to imply no gap.
Data were analyzed using SPSS v.21 using descriptive and analytical statistics, including Mann-Whitney, Kruskal-Wallis, Wilcoxon, and Spearman correlation coefficients tests. The normality of data was evaluated using the Kolmogorov-Smirnov test and all data and variables were not normally distributed considering P<0.05, so the non-parametric tests were used to analyze the obtained data. The significance level was considered as 0.05.
3. Results
A total of 61 male and 179 female patients referred to the government clinics. The mean (SD) age of the patients was 33.38(9.1) years. The percentages of married and single patients were 85.8% (n=206) and 14.2% (n=34) respectively. In terms of educational level, 52.5% (n=126) had academic educations, 26.7% (n=64) diploma, 17.5% (n=42) high school and junior high students, and 3.3% (n=8) primary education.
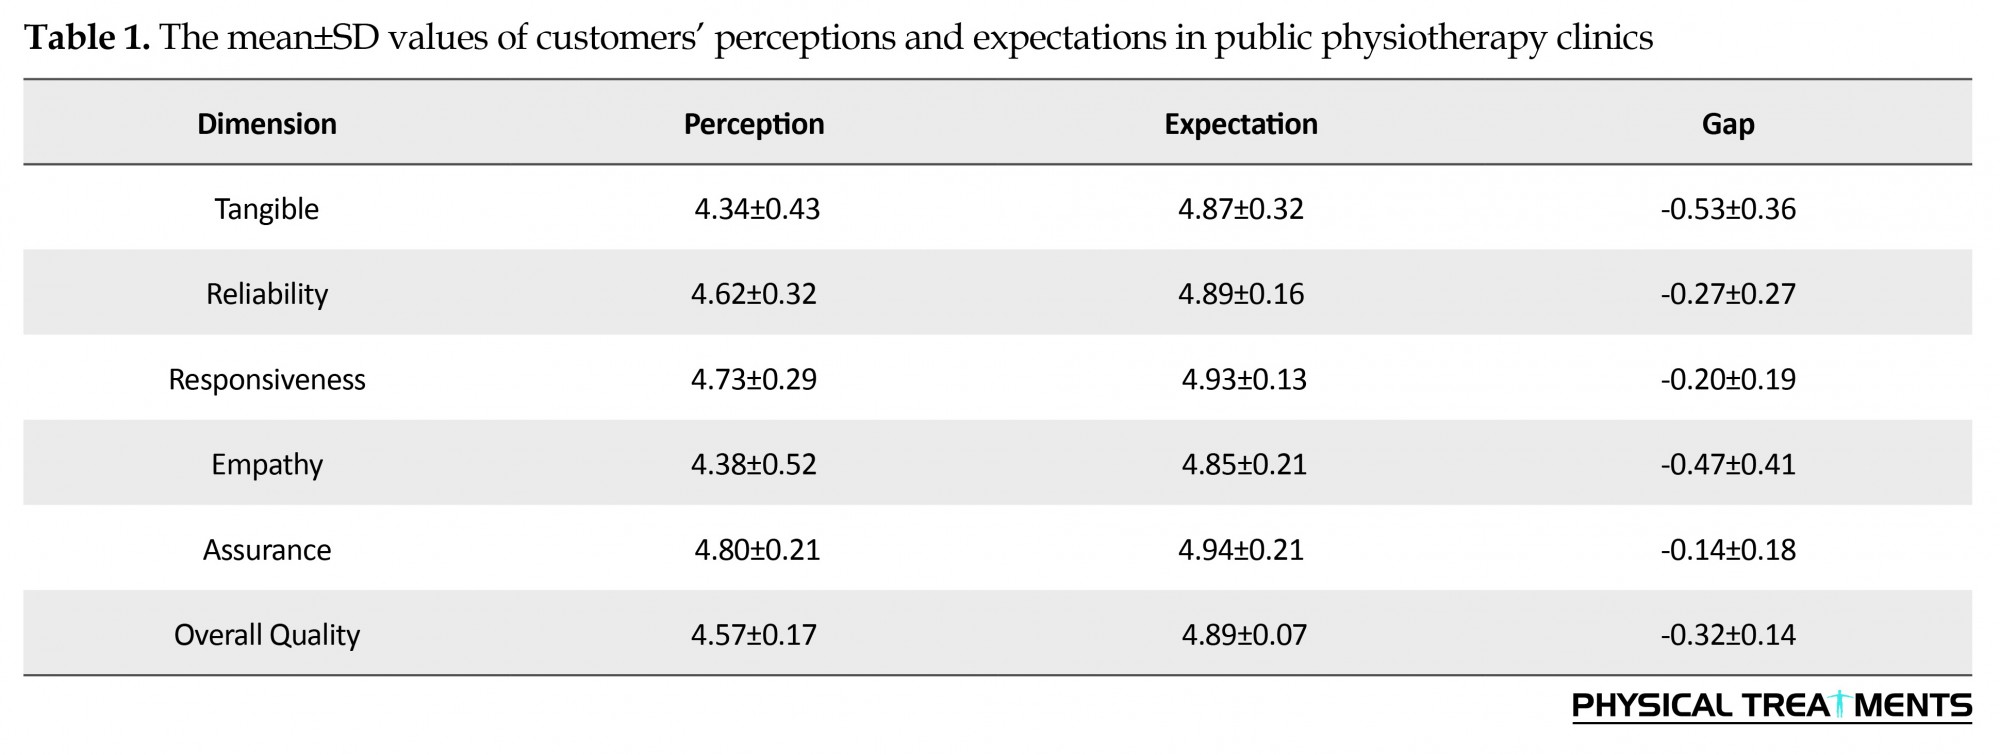
Table 1 presents the average scores of expectations, perceptions, and their gaps in physiotherapy service quality in Zahedan government clinics. Accordingly, the expectations of patients at public clinics were higher than their perceptions in all dimensions. The highest average score of the expectation was related to the assurance and the lowest score belonged to the empathy. At the government clinics, the highest average score of the perception was recorded for the assurance dimension while the tangibility attained the lowest score. The calculated difference between the average scores of expectations and perceptions revealed gaps in all dimensions of the quality. The greatest average of negative gap score was related to tangibility whereas the lowest gap belonged to the assurance (Table 1).
urrently, the international community has allocated a specific priority over the quality of the product and better services. Low quality goods and services always make the consumers gradually lose their trust and confidence towards the suppliers of goods and providers of services. Finally, dissatisfaction and negative propaganda provide the ground for the destruction of the producer or service provider. Therefore, product quality has a strategic value in any company [1]. Although the issue of quality is widely regarded in the fields of production and industry, it has scarcely been addressed in the service sector due to its nature, i.e., the invisibility of the service. However, many fields in the service sector exist in which the concepts of quality and quality management can be designed and implemented, thereby, taking an effective action to improve the methods of service and customer satisfaction.
Traditional attitudes define quality based on the characteristics of goods or services. According to new methods and approaches, however, quality is defined as the demands of customers. Quality is not determined nor defined by the service-provider organizations; the customers rather determine the quality [2]. Parasuraman et al. defined service quality as “what the customers have understood” denoting that quality arises from a comparison between the expectations of services they receive with their perceptions of the performance of service providers [3].
American theorists mention four characteristics as the essence of an ideal management, one of which is to accept the fact that perceptions and expectations of customers are the main factors determining the quality [4]. Chin and Pun presented a model for the quality improvement of services and indicate feedback from customers as one of the essential steps. The feedbacks received from customers helps prioritize areas in need for continuous improvement, taking into account the limitations of time, resources, and other factors [5].
According to one study, the quality of services can be defined and measured through comparison of customer expectations and perceptions with the service performance. Thus, if perceptions surpass expectations, the service seems to be of a high quality and vice versa [6]. However, there is often no congruence between the management knowledge of consumers’ perceptions and expectations and their actual expectations and perceptions, which can damage the quality of services [6].
The first basic step is to recognize the customers’ perceptions and expectations of service quality and determine the quality gap followed by adopting strategies to reduce the gap and satisfy the customers. In this case, not only conscious prioritizing and strategic resource allocation are facilitated, but also a basis is provided to improve the quality and effectiveness of services. Thereby, proper understanding of customers’ expectations as well as their perceptions of the services provided allow the managers to establish their judgment and actions based on the facts and not on suppositions [7]. Quality has several dimensions. Zeithmal et al. conducted a study on the dimensions of quality. Based on their results, the main dimensions of service quality are as follows [3].
1. Reliability of the service: The ability to perform the service reliably so that it fulfils the expectations of the customer. Another sense of reliability is to fulfil obligations; 2. Responsiveness: Responsibility or accountability means the willingness to cooperate and assist with the customer. This dimension of service quality emphasizes on showing sensitivity and awareness regarding requests, inquiries, and complaints of customers; 3. Assurance: Warranty and guarantee demonstrate the competency of staff to induce a sense of confidence to the customer; 4. Empathy: Empathy means that people are specially dealt with according to their individual mentality so that customers are convinced that agencies value them for the organization; and 5. Tangible dimension. This dimension includes the availability of facilities, equipment, staff, and communication channels. All of these aspects provide an image taken into account by customers (especially new customers) to assess the quality.
Parasuraman et al. developed a tool using five dimensions of service quality to evaluate service quality from the customers’ viewpoints. The tool is called SERVQUAL in the quality literature and has been developed to measure quality based on perceptions and expectations of customers in a wide range of services whereas other tools of measuring service quality are applicable in appraising only one kind of service. The degree of difference between customers’ expectations and perceptions of the service provided is called the service quality gap [8]. The service delivery process can be improved by determining the gap between perceptions and expectations of customers; thereby, customer satisfaction is achieved as a very sensitive element in today’s competitive world. In other words, the quality of the services can be obtained through evaluation of their effectiveness [8].
Both national and international studies have been carried out in this field, so a few cases are noted below. Gholami et al. studied the quality gap in primary health care using SERVQUAL questionnaire in Urmia health centers [9]. Kebriaie et al. also evaluated the quality gap in primary health care in Kashan health centers [10]. Tarrahi et al. examined the quality of health services provided in Khorramabad health centers using SERVQUAL [11]. Zarei et al. conducted a study on patients admitted to private hospitals in Iran to evaluate the service qualities [12]. Campbell et al. studied the quality of primary health care services provided to patients in London health centers [13]. Lim and Tang assessed the quality of services provided at hospitals through examining the patients’ perceptions and expectations [14]. Caridys studied the expectations and perceptions of dental services qualities in Greek patients [15]. Mehrizi et al. (2013) investigated the quality of physiotherapy services in the physiotherapy clinics of university hospitals in Malaysia [16].
Among rehabilitation services, those concerned with physiotherapy have a special position because of many positive changes to treat a range of diseases, which are gaining growing interest due to lack of side effects (as those exist in medicinal treatment) [17]. Obviously, the quality of physiotherapy services provided to patients is of great importance; the higher the quality of physiotherapy services offered to the patients, the better the health of the society will be. Considering the importance of knowing patients’ viewpoints in improving the quality of physiotherapy services and eliminating or reducing the gap between the current and desired status of quality, little research on physiotherapy services in Iran as well as lack of relevant studies in the city of Zahedan, this study aimed at examining the quality gap in physiotherapy services based on the patients’ perceptions and expectations.
2. Materials and Methods
This cross-sectional study was carried out on the patients referred to the government physiotherapy clinics in Zahedan from July 2015 April 2016. A sample size of 240 individuals was determined using available related studies. After the sample size was determined, according to the list of patients per clinic, a simple random sampling method was executed using random numbers. The number of samples per clinic was determined as a quota. Based on the experience, relatively greater numbers of patients were selected among those referred at an earlier time in the clinics with higher counts of patients.
To collect the data, two kinds of questionnaires were used; demographic profile of patients and the standard SERVQUAL questionnaire. The latter has five dimensions of service quality (tangibility, reliability, responsiveness, assurance, and empathy). Then the reliability and validity of the questionnaire were assessed. In this regard, the questionnaire was sent to a number of experts in this field and approved with certain modifications. In order to determine the reliability, first the prepared questionnaire was given to 30 patients referred to the clinic. The Persian SERVQUAL questionnaire showed statistically significant good convergent validity. The Cronbach α coefficient for the Persian SERVQUAL questionnaire was found to be 86%. The Persian SERVQUAL questionnaire components showed good to excellent test-retest reliability with intraclass correlation coefficient range from 0.73 to 0.84 (P<0.01).
The inclusion criteria included both male and female outpatients referred to clinics, and those who had spent at least five therapy sessions [16]. The exclusion criteria included patients who were admitted at different wards and also illiterate patients who were unable to speak.
The questionnaire has 22 questions in which tangibility, reliability and responsiveness each has four questions, and assurance and empathy five questions. The questions were scored from 1 to 5. Score 1 indicates “very bad” and 5 refers to “very good” situation with regard to the perceptions part. In the expectations section, 1 refers to “very unimportant” and 5 to “very important” conditions. To determine the quality gap, the patients’ scores concerning the quality of present physiotherapy services (their perceptions of the quality of services provided) were compared with their scores of the quality of optimal physiotherapy services (their expectations of the service quality). If the resultant score was positive, it would indicate that provided physiotherapy services exceeded the expectations of patients. A negative score would mean that the provided physiotherapy services did not meet their expectations, hence, there is a quality gap. A score of 0 was considered to imply no gap.
Data were analyzed using SPSS v.21 using descriptive and analytical statistics, including Mann-Whitney, Kruskal-Wallis, Wilcoxon, and Spearman correlation coefficients tests. The normality of data was evaluated using the Kolmogorov-Smirnov test and all data and variables were not normally distributed considering P<0.05, so the non-parametric tests were used to analyze the obtained data. The significance level was considered as 0.05.
3. Results
A total of 61 male and 179 female patients referred to the government clinics. The mean (SD) age of the patients was 33.38(9.1) years. The percentages of married and single patients were 85.8% (n=206) and 14.2% (n=34) respectively. In terms of educational level, 52.5% (n=126) had academic educations, 26.7% (n=64) diploma, 17.5% (n=42) high school and junior high students, and 3.3% (n=8) primary education.
Table 1 presents the average scores of expectations, perceptions, and their gaps in physiotherapy service quality in Zahedan government clinics. Accordingly, the expectations of patients at public clinics were higher than their perceptions in all dimensions. The highest average score of the expectation was related to the assurance and the lowest score belonged to the empathy. At the government clinics, the highest average score of the perception was recorded for the assurance dimension while the tangibility attained the lowest score. The calculated difference between the average scores of expectations and perceptions revealed gaps in all dimensions of the quality. The greatest average of negative gap score was related to tangibility whereas the lowest gap belonged to the assurance (Table 1).
There was a negative quality gap in the study of individual phrases. The highest and lowest values of average quality gap, respectively, were recorded for the phrase “cleanliness of health centre environment” in the tangibility dimension and the phrase “courteous and polite behavior towards client” in the assurance dimension (Table 2).
The difference between the males and females was not statistically significant in terms of overall average quality gap as shown by the Mann-Whitney test. Furthermore, the Kruskal-Wallis test revealed no significant differences between the average gaps with respect to educational level of the subjects. The average gaps in five dimensions of physiotherapy services quality were not significant in terms of gender, marital status, and educational level (Tables 3 and 4).
4. Discussion
The results of the present research showed negative gaps in all aspects of the quality of physiotherapy services and the related measurement phrases. Moreover, the average scores of expectations were higher than those of perceptions in all service quality dimensions. A negative gap implies that the patients’ expectations are beyond their perceptions of the status quo, thus, there is a large gap for satisfying those referring to physiotherapy clinics and achieving the desired status. The greater gap between the people’s perceptions and expectations and the quality of physiotherapy services indicate that this aspect of service quality has not received proper attention; hence, planning should be more focused on the aspects with the greatest gap. It should be noted that poor quality with an aspect of service quality has an exacerbating effect, i.e., it reduces other aspects of service quality from the perspective of the recipient [18].
In this study, the utmost gap was observed in the tangibility dimension in government clinics, i.e., the clients have evaluated these dimensions as the most important ones. Kebriaie [10] found the highest gap in the responsiveness in Kashan health centers. Roohi and Aghamollaie [19, 20] detected empathy in Gorgan and Bandar Abbas health centers, respectively. Mohammadi [21] observed the reliability in Zanjan, and Tarrahi et al. [11] in Khorramabad and Zarei [12] discovered the greatest gap in empathy. In similar studies, Lim and Tang reported the largest service gap in the responsiveness in Singapore hospitals [17]. Mick and Hazel found the reliability in Scotland hospitals [22] and Karydys detected the responsiveness on the quality of dental services [15], and ultimately, Naser-Aldin Mehrizi recognized the highest gap in the tangibility [16].
In this study, the smallest gap or, in other words, the most appropriate aspect of service quality was the assurance dimension. The lowest average gaps in the studies of Kebriaie [10], Roohi [19], Aghamolaie [20], Mohammadi [21], and Tarrahi [11], respectively, were reported to be in tangibility, reliability, assurance, tangibility, and reliability. Zarei discovered the greatest gap in tangibility dimension [12]. The lowest gaps detected by Lim and Tang [14], Mick and Hazel [22], Karydys [15], and Naser-Aldin Mehrizi [16] were respectively in the tangibility, responsiveness, and assurance dimensions.
In this study, the mean quality gap did not show significant relationships with the age, gender, and educational levels. In the study of Mollaaghaie in Bandar Abbas health centers, the quality gap was not significantly associated with the variables of age, education, occupation, and the length of service usage [20]. In Khorramabad health centers, Tarrahi observed an inverse correlation between mean quality gap and the patients’ age, but it did not show significant relationships with the gender and education [11]. Scrimgeour et al. reported that younger patients had higher expectations of the service quality [23].
Considering the results of this study and comparing them with other similar studies, the quality gaps in various aspects of services are different from one another with respect to different individuals and also of various demographic and social groups. Therefore, administrators should carry out such research as an essential first step to develop programs for improving the quality of their organizations. Previous studies have mentioned lack of information as one of the major obstacles in the implementation of programs for improving the quality of services [24]. Therefore, such studies about the quality of services will enable management to, besides preventing the quality loss, spend their limited financial resources available in such a way that the organizational performance improves in the areas with the greatest impacts on the customers’ perceptions and expectations of service quality.
Based on the results of this study that the largest service gap was in the tangibility dimension from in Zahedan public clinics, the most important issue facing the negative gap between the expectations and perceptions can be caused by lack of resources and equipment, poor management, improper planning, authorities’ inattention to the expectations and demands of service recipients, people’s high expectations, and so on. Therefore, it is recommended that officials at government physiotherapy clinics pay more attention to the opinions of clients, welcome their critics and suggestions on the reform and workplace issues, receive more feedback on the issues and therapy outcomes of the patients, and provide services during all working hours not limited to a specific time. The staff and physiotherapists should show increasing interest to the patients, try to treat them pleasantly, and better understand their issues and problems. Additionally, customer service training courses and workshops on increasing communication skills can be organized to enable the medical staff to properly communicate with their patients.
Based on the results, perception of patients in all dissentions was lower than their expectations. Therefore, there are some opportunities for improving physiotherapy services in these physiotherapy clinics. It is recommended that officials at government physiotherapy clinics pay attention to the opinions of clients more than ever, welcome their critics and suggestions on the reform and workplace issue.
Acknowledgments
The Ethics Committee of Zahedan University of Medical Science approved the study. The research was funded by Zahedan University of Medical Sciences. The authors sincerely appreciate the Vice President of Research at Zahedan University of Medical Sciences for funding the research project, also the physiotherapist colleagues in Zahedan public clinics (Project NO.: 7380, Main Researcher Ahmad Reza Asgari Ashtiani), and all patients and people who helped us carry out this study.
Conflict of Interest
Authors declared no conflicts of interest.
References
- Gitman LJ, McDaniel C. The future of business: The essentials . Mason, OH: South-Western Cengage Learning; 2009.
- West E. Management matters: The link between hospital organisation and quality of patient care. Quality in Health Care. 2001; 10(1):40–8. doi: 10.1136/qhc.10.1.40
- Parasuraman A, Berry L, Zeithaml VA. SERVQUAL: A multi-item scale for measuring customer perceptions of service. Journal of Retailing. 1988; 64(1):12-40.
- Sharma B, Gadenne D. An investigation of the perceived importance and effectiveness of quality management approaches. The TQM Magazine. 2001; 13(6):433–45. doi: 10.1108/eum0000000006180
- Chin K, Pun K. A proposed framework for implementing TQM in Chinese organizations. International Journal of Quality & Reliability Management. 2002; 19(3):272–94. doi: 10.1108/02656710210415686
- Donnelly M, Wisniewski M, Dalrymple JF, Curry AC. Measuring service quality in local government: the SERVQUAL approach. International Journal of Public Sector Management. 1995; 8(7):15–20. doi: 10.1108/09513559510103157
- Karydis A. Expectations and perceptions of Greek patients regarding the quality of dental health care. International Journal for Quality in Health Care. 2001; 13(5):409–16. doi: 10.1093/intqhc/13.5.409
- Nwabueze U. How the mighty have fallen: The naked truth about TQM. Managerial Auditing Journal. 2001; 16(9):504–13. doi: 10.1108/02686900110406601
- Gholami A, Salarilak S, Gharaaghaji R, Sadaghiyanifar A, Moosavi Jahromi L. [Quality gap in primary health care in Urmia health care center in 2009 (Persian)]. Urmia Medical Journal. 2010; 21(4):347-53.
- Kebriaei A, Akbari F, Hosseini M, Eftekhar Ardabili H, Pourreza A. [Survey on quality gap in primary health care in Kashan health centers (Persian)]. Journal of Qazvin University of Medical Sciences. 2004; 31: 82-88.
- Tarahi MJ, Hamozaheh P, Bizhanvand M, Lashgari B. [The quality of Health care services provided in health care centers of Khorramabad using SERVQUAL Model in 2010 (Persian)]. Yafte. 2012; 14(1):13-21.
- Zarei A, Arab M, Froushani AR, Rashidian A, Tabatabaei SM. Service quality of private hospitals: The Iranian Patients' perspective. BMC health services research. 2012; 12(1):31. https://doi.org/10.1186/1472-6963-12-31
- Campbell JL, Ramsay J, Green J. Age, gender, socioeconomic, and ethnic differences in patients' assessments of primary health care. BMJ Quality & Safety. 2001; 10(2):90-5. doi: 10.1136/qhc.10.2.90
- Cheng Lim P, Tang NKH. A study of patients’ expectations and satisfaction in Singapore hospitals. International Journal of Health Care Quality Assurance. 2000; 13(7):290–9. doi: 10.1108/09526860010378735
- Karydis A. Expectations and perceptions of Greek patients regarding the quality of dental health care. International Journal for Quality in Health Care. 2001; 13(5):409–16. doi: 10.1093/intqhc/13.5.409
- Mahdzir MN, Aniza I, Faridah AR, Sulha A. Assessing the service quality of physiotherapy services: A cross sectional study at teaching hospitals in Klang Valley, Malaysia. Malaysian Journal of Public Health Medicine. 2013; 13(2):27-37.
- Tabrizi J , Gharibi F, Eteraf Oskoee A, Asghari Jafarabadi M. Service quality in physiotherapy from the services recipients perspective. Jentashapir Journal of Health Research (Jentashapir). 2013; 4(1):53-63.
- Brady MK, Cronin JJK. Some new thoughts on conceptualizing perceived services quality: A Hierarchical Approach. Journal of Marketing. 2001; 65(3):34-49. doi: 10.1509/jmkg.65.3.34.18334
- Rohi G, Nasiri H, Hesam M, Mirkarimi F, Asaiesh H. [Quality of primary health services in Gorgan health care services centers (Persian)]. Journal of Research Development in Nursing & Midwifery. 2009; 6(2):9-17.
- Aghamolaei T, Zare SH, Kebriaei A, Pudat A. [Quality of primary health services from View of female clients of Bandarabbas health care services centers (Persian)]. Payesh. 2008; 7(2):121-7.
- Mohammadi A, Shoghli AR. [Survey on quality of primary health cares in Zanjan District Health Centers (Persian)]. Zanjan University of Medical Sciences Journal. 2009; 16(65):89-100.
- Wisniewski M, Wisniewski H. Measuring service quality in a hospital colposcopy clinic. International Journal of Health Care Quality Assurance. 2005; 18(3):217–28. doi: 10.1108/09526860510594776
- Scrimgeour EM, Barnes JA. How do multiple sclerosis patients in Lanarkshire rate health professionals and hospitals. Health Bulletin. 2001; 59(3):155-7.
- Chin K, Pun K. A proposed framework for implementing TQM in Chinese organizations. International Journal of Quality & Reliability Management. 2002; 19(3):272–94. doi: 10.1108/02656710210415686
Type of Study: Research |
Subject:
Special
Received: 2017/02/12 | Accepted: 2017/05/23 | Published: 2017/07/1
Received: 2017/02/12 | Accepted: 2017/05/23 | Published: 2017/07/1
References
1. Gitman LJ, McDaniel C. The future of business: The essentials . Mason, OH: South-Western Cengage Learning; 2009.
2. West E. Management matters: The link between hospital organisation and quality of patient care. Quality in Health Care. 2001; 10(1):40–8. doi: 10.1136/qhc.10.1.40 [DOI:10.1136/qhc.10.1.40]
3. Parasuraman A, Berry L, Zeithaml VA. SERVQUAL: A multi-item scale for measuring customer perceptions of service. Journal of Retailing. 1988; 64(1):12-40.
4. Sharma B, Gadenne D. An investigation of the perceived importance and effectiveness of quality management approaches. The TQM Magazine. 2001; 13(6):433–45. doi: 10.1108/eum0000000006180 [DOI:10.1108/EUM0000000006180]
5. Chin K, Pun K. A proposed framework for implementing TQM in Chinese organizations. International Journal of Quality & Reliability Management. 2002; 19(3):272–94. doi: 10.1108/02656710210415686 [DOI:10.1108/02656710210415686]
6. Donnelly M, Wisniewski M, Dalrymple JF, Curry AC. Measuring service quality in local government: the SERVQUAL approach. International Journal of Public Sector Management. 1995; 8(7):15–20. doi: 10.1108/09513559510103157 [DOI:10.1108/09513559510103157]
7. Karydis A. Expectations and perceptions of Greek patients regarding the quality of dental health care. International Journal for Quality in Health Care. 2001; 13(5):409–16. doi: 10.1093/intqhc/13.5.409 [DOI:10.1093/intqhc/13.5.409]
8. Nwabueze U. How the mighty have fallen: The naked truth about TQM. Managerial Auditing Journal. 2001; 16(9):504–13. doi: 10.1108/02686900110406601 [DOI:10.1108/02686900110406601]
9. Gholami A, Salarilak S, Gharaaghaji R, Sadaghiyanifar A, Moosavi Jahromi L. [Quality gap in primary health care in Urmia health care center in 2009 (Persian)]. Urmia Medical Journal. 2010; 21(4):347-53.
10. Kebriaei A, Akbari F, Hosseini M, Eftekhar Ardabili H, Pourreza A. [Survey on quality gap in primary health care in Kashan health centers (Persian)]. Journal of Qazvin University of Medical Sciences. 2004; 31: 82-88.
11. Tarahi MJ, Hamozaheh P, Bizhanvand M, Lashgari B. [The quality of Health care services provided in health care centers of Khorramabad using SERVQUAL Model in 2010 (Persian)]. Yafte. 2012; 14(1):13-21.
12. Zarei A, Arab M, Froushani AR, Rashidian A, Tabatabaei SM. Service quality of private hospitals: The Iranian Patients' perspective. BMC health services research. 2012; 12(1):31. [DOI:10.1186/1472-6963-12-31]
13. Campbell JL, Ramsay J, Green J. Age, gender, socioeconomic, and ethnic differences in patients' assessments of primary health care. BMJ Quality & Safety. 2001; 10(2):90-5. doi: 10.1136/qhc.10.2.90 [DOI:10.1136/qhc.10.2.90]
14. Cheng Lim P, Tang NKH. A study of patients' expectations and satisfaction in Singapore hospitals. International Journal of Health Care Quality Assurance. 2000; 13(7):290–9. doi: 10.1108/09526860010378735 [DOI:10.1108/09526860010378735]
15. Karydis A. Expectations and perceptions of Greek patients regarding the quality of dental health care. International Journal for Quality in Health Care. 2001; 13(5):409–16. doi: 10.1093/intqhc/13.5.409 [DOI:10.1093/intqhc/13.5.409]
16. Mahdzir MN, Aniza I, Faridah AR, Sulha A. Assessing the service quality of physiotherapy services: A cross sectional study at teaching hospitals in Klang Valley, Malaysia. Malaysian Journal of Public Health Medicine. 2013; 13(2):27-37.
17. Tabrizi J, Gharibi F, Eteraf Oskoee A, Asghari Jafarabadi M. Service quality in physiotherapy from the services recipients perspective. Jentashapir Journal of Health Research (Jentashapir). 2013; 4(1):53-63.
18. Brady MK, Cronin JJK. Some new thoughts on conceptualizing perceived services quality: A Hierarchical Approach. Journal of Marketing. 2001; 65(3):34-49. doi: 10.1509/jmkg.65.3.34.18334 [DOI:10.1509/jmkg.65.3.34.18334]
19. Rohi G, Nasiri H, Hesam M, Mirkarimi F, Asaiesh H. [Quality of primary health services in Gorgan health care services centers (Persian)]. Journal of Research Development in Nursing & Midwifery. 2009; 6(2):9-17.
20. Aghamolaei T, Zare SH, Kebriaei A, Pudat A. [Quality of primary health services from View of female clients of Bandarabbas health care services centers (Persian)]. Payesh. 2008; 7(2):121-7.
21. Mohammadi A, Shoghli AR. [Survey on quality of primary health cares in Zanjan District Health Centers (Persian)]. Zanjan University of Medical Sciences Journal. 2009; 16(65):89-100.
22. Wisniewski M, Wisniewski H. Measuring service quality in a hospital colposcopy clinic. International Journal of Health Care Quality Assurance. 2005; 18(3):217–28. doi: 10.1108/09526860510594776 [DOI:10.1108/09526860510594776]
23. Scrimgeour EM, Barnes JA. How do multiple sclerosis patients in Lanarkshire rate health professionals and hospitals. Health Bulletin. 2001; 59(3):155-7. [PMID]
24. Chin K, Pun K. A proposed framework for implementing TQM in Chinese organizations. International Journal of Quality & Reliability Management. 2002; 19(3):272–94. doi: 10.1108/02656710210415686 [DOI:10.1108/02656710210415686]
Send email to the article author
| Rights and permissions | |
 |
This work is licensed under a Creative Commons Attribution-NonCommercial 4.0 International License. |
Physical Treatments (PTJ)
University of Social Welfare and Rehabilitation Sciences, Koodakyar Alley, Daneshjoo Blv., Evin, Tehran, Iran
Journal Office Tel: +9821 71732822
Publisher Tel: +9821 4535 5555, 4535 5000 (EXT: 108)
Email: physicaltreatments@gmail.com